Zip Codes with the Highest Percentage of Population Employed in Manufacturing in Nashua, NH
RELATED REPORTS & OPTIONS
Manufacturing
Nashua
Compare Zip Codes
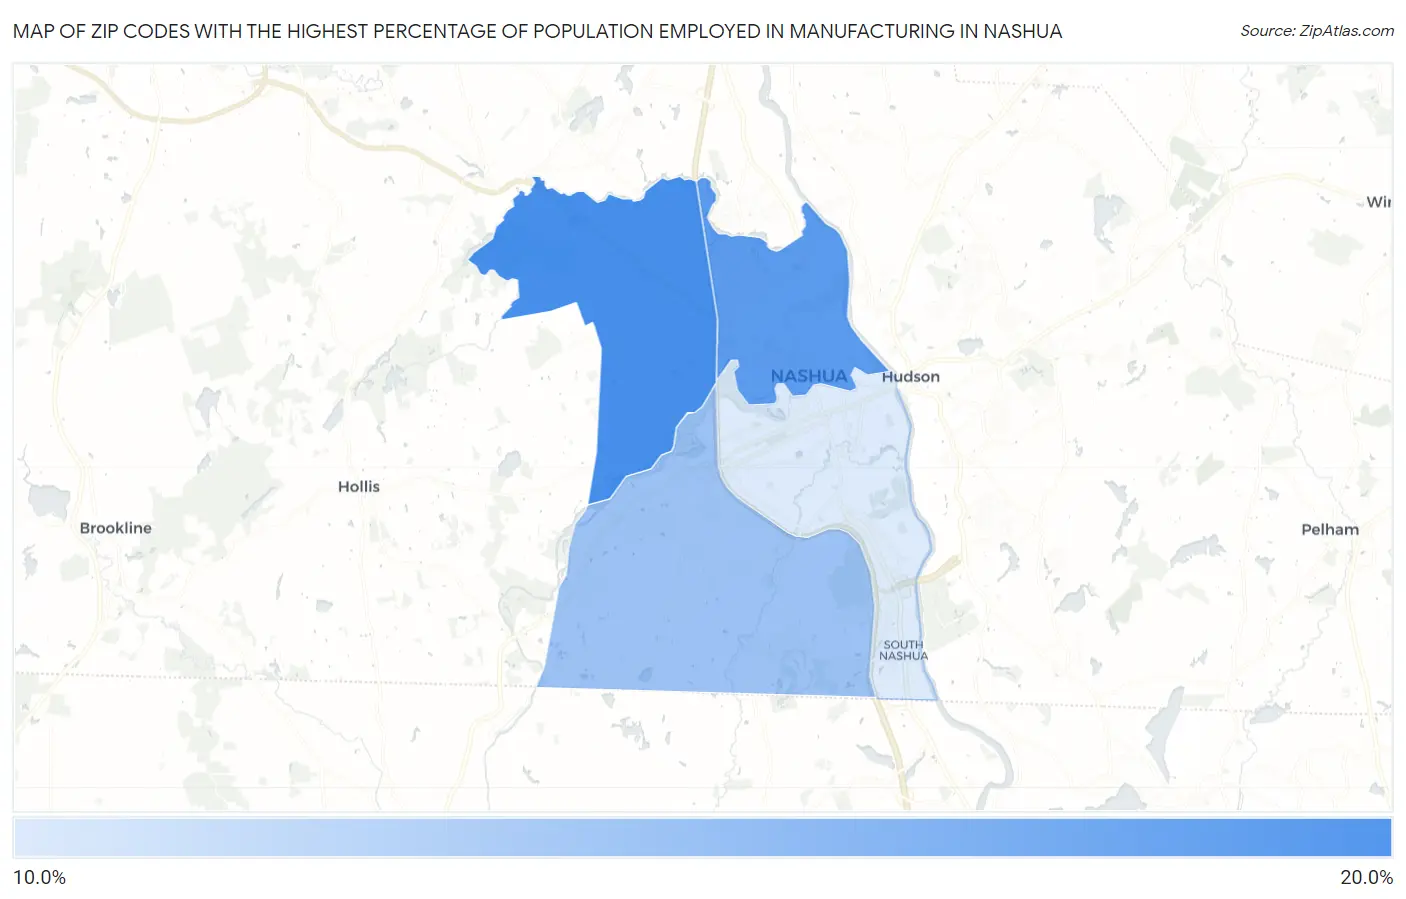
Map of Zip Codes with the Highest Percentage of Population Employed in Manufacturing in Nashua
14.4%
16.3%
Zip Codes with the Highest Percentage of Population Employed in Manufacturing in Nashua, NH
| Zip Code | % Employed | vs State | vs National | |
| 1. | 03063 | 16.3% | 13.0%(+3.32)#60 | 10.0%(+6.28)#7,769 |
| 2. | 03064 | 16.0% | 13.0%(+3.10)#62 | 10.0%(+6.05)#7,967 |
| 3. | 03062 | 15.3% | 13.0%(+2.31)#71 | 10.0%(+5.27)#8,779 |
| 4. | 03060 | 14.4% | 13.0%(+1.49)#87 | 10.0%(+4.45)#9,659 |
1
Common Questions
What are the Top 3 Zip Codes with the Highest Percentage of Population Employed in Manufacturing in Nashua, NH?
Top 3 Zip Codes with the Highest Percentage of Population Employed in Manufacturing in Nashua, NH are:
What zip code has the Highest Percentage of Population Employed in Manufacturing in Nashua, NH?
03063 has the Highest Percentage of Population Employed in Manufacturing in Nashua, NH with 16.3%.
What is the Percentage of Population Employed in Manufacturing in Nashua, NH?
Percentage of Population Employed in Manufacturing in Nashua is 15.3%.
What is the Percentage of Population Employed in Manufacturing in New Hampshire?
Percentage of Population Employed in Manufacturing in New Hampshire is 13.0%.
What is the Percentage of Population Employed in Manufacturing in the United States?
Percentage of Population Employed in Manufacturing in the United States is 10.0%.