Zip Codes with the Highest Percentage of Population Employed in Education Instruction & Library in Lincoln, NE

RELATED REPORTS & OPTIONS

Education Instruction & Library
Population
Families and Households
Female Fertility
Female Fertility (Unmarried)
Race (Community Size)
Race (Percentage)
Ancestry (Community Size)
AfghanAfricanAlaska NativeAlbanianAmericanApacheArabArgentineanArmenianAustralianAustrianBangladeshiBelgianBhutaneseBlackfeetBrazilianBritishBritish West IndianBulgarianBurmeseCanadianCelticCentral AmericanCentral American IndianCherokeeChileanChippewaChoctawColombianCosta RicanCreekCroatianCubanCzechCzechoslovakianDanishDominicanDutchEastern EuropeanEcuadorianEgyptianEnglishEthiopianEuropeanFilipinoFinnishFrenchFrench American IndianFrench CanadianGermanGerman RussianGhanaianGreekGuamanian / ChamorroGuatemalanHaitianHonduranHungarianIcelanderIndian (Asian)IndonesianIranianIraqiIrishIroquoisItalianJamaicanJapaneseJordanianKenyanKoreanLaotianLatvianLebaneseLithuanianLuxembourgerMalaysianMexicanMexican American IndianMongolianMoroccanNative HawaiianNavajoNicaraguanNigerianNorthern EuropeanNorwegianPakistaniPalestinianPanamanianPennsylvania GermanPeruvianPolishPortuguesePotawatomiPuerto RicanRomanianRussianSalvadoranSamoanScandinavianScotch-IrishScottishSerbianSiouxSlavicSlovakSomaliSouth AmericanSouth American IndianSpaniardSpanishSri LankanSubsaharan AfricanSudaneseSwedishSwissSyrianThaiTrinidadian and TobagonianTurkishUkrainianVenezuelanVietnameseWelshWest IndianYugoslavian
Ancestry (Percentage)
AfghanAfricanAlaska NativeAlbanianAmericanApacheArabArgentineanArmenianAustralianAustrianBangladeshiBelgianBhutaneseBlackfeetBrazilianBritishBritish West IndianBulgarianBurmeseCanadianCelticCentral AmericanCentral American IndianCherokeeChileanChippewaChoctawColombianCosta RicanCreekCroatianCubanCzechCzechoslovakianDanishDominicanDutchEastern EuropeanEcuadorianEgyptianEnglishEthiopianEuropeanFilipinoFinnishFrenchFrench American IndianFrench CanadianGermanGerman RussianGhanaianGreekGuamanian / ChamorroGuatemalanHaitianHonduranHungarianIcelanderIndian (Asian)IndonesianIranianIraqiIrishIroquoisItalianJamaicanJapaneseJordanianKenyanKoreanLaotianLatvianLebaneseLithuanianLuxembourgerMalaysianMexicanMexican American IndianMongolianMoroccanNative HawaiianNavajoNicaraguanNigerianNorthern EuropeanNorwegianPakistaniPalestinianPanamanianPennsylvania GermanPeruvianPolishPortuguesePotawatomiPuerto RicanRomanianRussianSalvadoranSamoanScandinavianScotch-IrishScottishSerbianSiouxSlavicSlovakSomaliSouth AmericanSouth American IndianSpaniardSpanishSri LankanSubsaharan AfricanSudaneseSwedishSwissSyrianThaiTrinidadian and TobagonianTurkishUkrainianVenezuelanVietnameseWelshWest IndianYugoslavian
Immigrant Origin (Total)
AfghanistanAfricaArgentinaAsiaAustraliaAustriaBangladeshBelarusBelgiumBosnia and HerzegovinaBrazilBurma / MyanmarCambodiaCameroonCanadaCaribbeanCentral AmericaChinaColombiaCosta RicaCubaDominican RepublicEastern AfricaEastern AsiaEastern EuropeEl SalvadorEnglandEthiopiaEuropeFranceGermanyGhanaGreeceGuatemalaHaitiHondurasHong KongHungaryIndiaIndonesiaIranIraqItalyJamaicaJapanJordanKazakhstanKenyaKoreaKuwaitLaosLatin AmericaLatviaLebanonLiberiaMalaysiaMexicoMiddle AfricaMoldovaMoroccoNepalNetherlandsNigeriaNorthern AfricaNorthern EuropeOceaniaPakistanPanamaPeruPhilippinesPolandRomaniaRussiaSaudi ArabiaScotlandSerbiaSomaliaSouth AmericaSouth Central AsiaSouth Eastern AsiaSouthern EuropeSpainSudanSwedenSyriaTaiwanThailandTrinidad and TobagoUgandaUkraineUzbekistanVenezuelaVietnamWestern AfricaWestern AsiaWestern EuropeZaire
Immigrant Origin (Percentage)
AfghanistanAfricaArgentinaAsiaAustraliaAustriaBangladeshBelarusBelgiumBosnia and HerzegovinaBrazilBurma / MyanmarCambodiaCameroonCanadaCaribbeanCentral AmericaChinaColombiaCosta RicaCubaDominican RepublicEastern AfricaEastern AsiaEastern EuropeEl SalvadorEnglandEthiopiaEuropeFranceGermanyGhanaGreeceGuatemalaHaitiHondurasHong KongHungaryIndiaIndonesiaIranIraqItalyJamaicaJapanJordanKazakhstanKenyaKoreaKuwaitLaosLatin AmericaLatviaLebanonLiberiaMalaysiaMexicoMiddle AfricaMoldovaMoroccoNepalNetherlandsNigeriaNorthern AfricaNorthern EuropeOceaniaPakistanPanamaPeruPhilippinesPolandRomaniaRussiaSaudi ArabiaScotlandSerbiaSomaliaSouth AmericaSouth Central AsiaSouth Eastern AsiaSouthern EuropeSpainSudanSwedenSyriaTaiwanThailandTrinidad and TobagoUgandaUkraineUzbekistanVenezuelaVietnamWestern AfricaWestern AsiaWestern EuropeZaire
Income
Income (Families)
Income (Households)
Poverty
Poverty (Families)
Unemployment
Employment Occupations
Employment Industries
Employer Class
Commute Time
Commute Means
School Enrollment
Education by Degree Field
Occupancy
Finances
Physical Characteristics
Lincoln
Compare Zip Codes
Comparison Subject

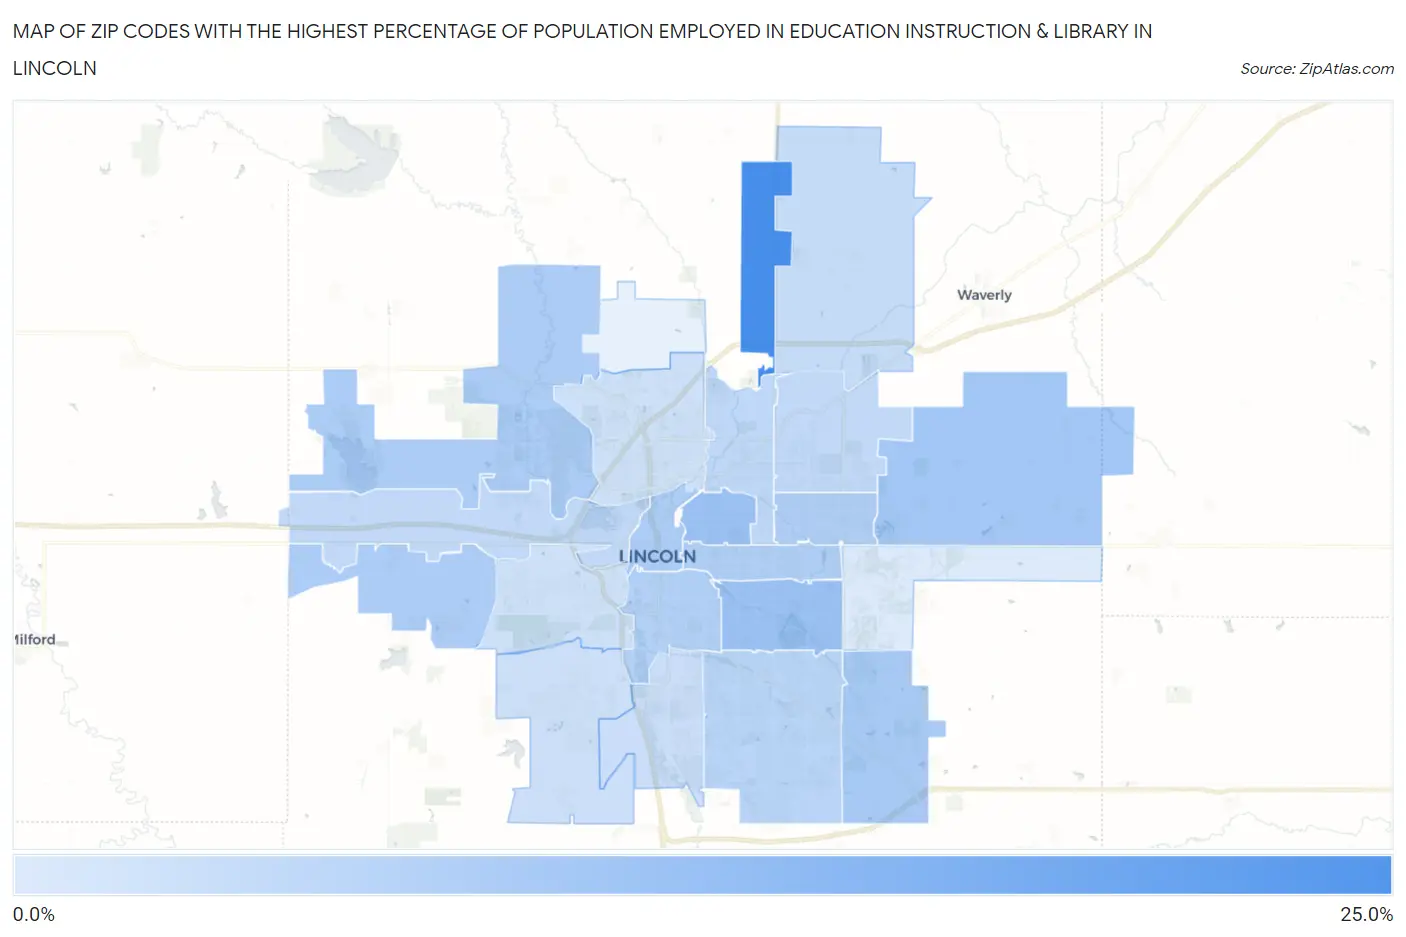
Map of Zip Codes with the Highest Percentage of Population Employed in Education Instruction & Library in Lincoln

0.0%
25.0%
Zip Codes with the Highest Percentage of Population Employed in Education Instruction & Library in Lincoln Map

Zip Codes with the Highest Percentage of Population Employed in Education Instruction & Library in Lincoln, NE

Zip Code % Employed vs State vs National
1.6851423.4%6.9%(+16.5)#66.2%(+17.2)#445
2.6850311.8%6.9%(+4.91)#486.2%(+5.65)#2,484
3.6850611.7%6.9%(+4.73)#526.2%(+5.47)#2,600
4.6852710.6%6.9%(+3.69)#676.2%(+4.43)#3,353
5.685269.9%6.9%(+3.00)#826.2%(+3.74)#4,028
6.685089.6%6.9%(+2.63)#966.2%(+3.37)#4,471
7.685329.4%6.9%(+2.49)#1016.2%(+3.23)#4,635
8.685249.3%6.9%(+2.39)#1066.2%(+3.13)#4,773
9.685059.1%6.9%(+2.18)#1196.2%(+2.92)#5,064
10.685108.7%6.9%(+1.78)#1326.2%(+2.52)#5,711
11.685028.4%6.9%(+1.49)#1426.2%(+2.23)#6,255
12.685167.6%6.9%(+0.701)#1766.2%(+1.44)#8,114
13.685047.1%6.9%(+0.168)#2166.2%(+0.908)#9,623
14.685286.9%6.9%(-0.068)#2276.2%(+0.672)#10,364
15.685076.8%6.9%(-0.079)#2296.2%(+0.662)#10,408
16.685176.1%6.9%(-0.783)#2826.2%(-0.043)#12,976
17.685125.5%6.9%(-1.41)#3256.2%(-0.667)#15,492
18.685235.4%6.9%(-1.49)#3296.2%(-0.746)#15,820
19.685215.1%6.9%(-1.81)#3496.2%(-1.07)#17,141
20.685225.1%6.9%(-1.82)#3506.2%(-1.08)#17,202
21.685203.3%6.9%(-3.62)#4276.2%(-2.88)#23,986

Common Questions

What are the Top 10 Zip Codes with the Highest Percentage of Population Employed in Education Instruction & Library in Lincoln, NE?
Top 10 Zip Codes with the Highest Percentage of Population Employed in Education Instruction & Library in Lincoln, NE are:
#1
23.4%
#2
11.8%
#3
11.7%
#4
10.6%
#5
9.9%
#6
9.6%
#7
9.4%
#8
9.3%
#9
9.1%
#10
8.7%
What zip code has the Highest Percentage of Population Employed in Education Instruction & Library in Lincoln, NE?
68514 has the Highest Percentage of Population Employed in Education Instruction & Library in Lincoln, NE with 23.4%.
What is the Percentage of Population Employed in Education Instruction & Library in Lincoln, NE?
Percentage of Population Employed in Education Instruction & Library in Lincoln is 8.0%.
What is the Percentage of Population Employed in Education Instruction & Library in Nebraska?
Percentage of Population Employed in Education Instruction & Library in Nebraska is 6.9%.
What is the Percentage of Population Employed in Education Instruction & Library in the United States?
Percentage of Population Employed in Education Instruction & Library in the United States is 6.2%.