Zip Codes with the Highest Percentage of Households Heated by Bottled Gas / Liquid Propane in Saint Louis, MO
RELATED REPORTS & OPTIONS
Bottled Gas / LP Heating
Saint Louis
Compare Zip Codes
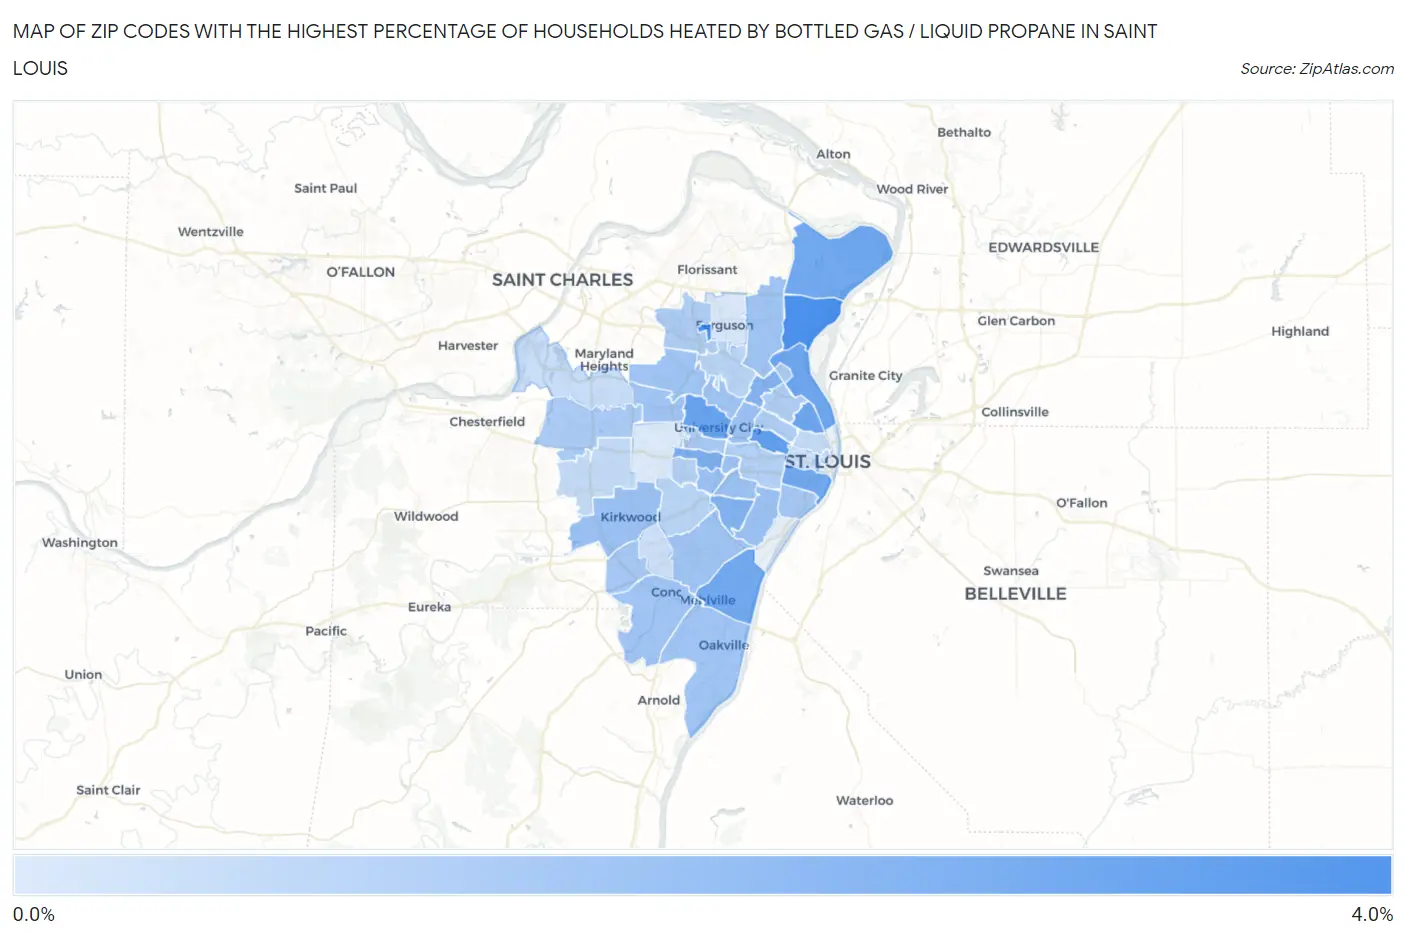
Map of Zip Codes with the Highest Percentage of Households Heated by Bottled Gas / Liquid Propane in Saint Louis
0.10%
3.1%
Zip Codes with the Highest Percentage of Households Heated by Bottled Gas / Liquid Propane in Saint Louis, MO
| Zip Code | Bottled Gas / LP Heating | vs State | vs National | |
| 1. | 63140 | 3.1% | 8.5%(-5.40)#851 | 4.9%(-1.80)#20,967 |
| 2. | 63137 | 3.0% | 8.5%(-5.50)#854 | 4.9%(-1.90)#21,037 |
| 3. | 63108 | 2.6% | 8.5%(-5.90)#858 | 4.9%(-2.30)#21,757 |
| 4. | 63130 | 2.4% | 8.5%(-6.10)#860 | 4.9%(-2.50)#22,164 |
| 5. | 63107 | 2.3% | 8.5%(-6.20)#862 | 4.9%(-2.60)#22,500 |
| 6. | 63147 | 2.3% | 8.5%(-6.20)#863 | 4.9%(-2.60)#22,501 |
| 7. | 63125 | 2.2% | 8.5%(-6.30)#864 | 4.9%(-2.70)#22,620 |
| 8. | 63104 | 2.2% | 8.5%(-6.30)#867 | 4.9%(-2.70)#22,687 |
| 9. | 63138 | 2.2% | 8.5%(-6.30)#868 | 4.9%(-2.70)#22,693 |
| 10. | 63117 | 2.0% | 8.5%(-6.50)#878 | 4.9%(-2.90)#23,288 |
| 11. | 63109 | 1.9% | 8.5%(-6.60)#881 | 4.9%(-3.00)#23,482 |
| 12. | 63120 | 1.9% | 8.5%(-6.60)#884 | 4.9%(-3.00)#23,586 |
| 13. | 63116 | 1.4% | 8.5%(-7.10)#904 | 4.9%(-3.50)#25,017 |
| 14. | 63122 | 1.4% | 8.5%(-7.10)#905 | 4.9%(-3.50)#25,020 |
| 15. | 63139 | 1.4% | 8.5%(-7.10)#907 | 4.9%(-3.50)#25,151 |
| 16. | 63112 | 1.4% | 8.5%(-7.10)#908 | 4.9%(-3.50)#25,180 |
| 17. | 63143 | 1.4% | 8.5%(-7.10)#910 | 4.9%(-3.50)#25,253 |
| 18. | 63129 | 1.3% | 8.5%(-7.20)#913 | 4.9%(-3.60)#25,358 |
| 19. | 63123 | 1.3% | 8.5%(-7.20)#914 | 4.9%(-3.60)#25,361 |
| 20. | 63136 | 1.3% | 8.5%(-7.20)#915 | 4.9%(-3.60)#25,388 |
| 21. | 63114 | 1.3% | 8.5%(-7.20)#916 | 4.9%(-3.60)#25,427 |
| 22. | 63128 | 1.3% | 8.5%(-7.20)#917 | 4.9%(-3.60)#25,464 |
| 23. | 63132 | 1.3% | 8.5%(-7.20)#918 | 4.9%(-3.60)#25,611 |
| 24. | 63133 | 1.3% | 8.5%(-7.20)#919 | 4.9%(-3.60)#25,654 |
| 25. | 63118 | 1.2% | 8.5%(-7.30)#922 | 4.9%(-3.70)#25,898 |
| 26. | 63127 | 1.2% | 8.5%(-7.30)#926 | 4.9%(-3.70)#26,054 |
| 27. | 63141 | 1.1% | 8.5%(-7.40)#928 | 4.9%(-3.80)#26,318 |
| 28. | 63105 | 1.1% | 8.5%(-7.40)#929 | 4.9%(-3.80)#26,332 |
| 29. | 63115 | 1.0% | 8.5%(-7.50)#934 | 4.9%(-3.90)#26,801 |
| 30. | 63134 | 1.0% | 8.5%(-7.50)#935 | 4.9%(-3.90)#26,815 |
| 31. | 63113 | 1.0% | 8.5%(-7.50)#937 | 4.9%(-3.90)#26,833 |
| 32. | 63110 | 0.90% | 8.5%(-7.60)#944 | 4.9%(-4.00)#27,201 |
| 33. | 63144 | 0.90% | 8.5%(-7.60)#945 | 4.9%(-4.00)#27,267 |
| 34. | 63119 | 0.80% | 8.5%(-7.70)#948 | 4.9%(-4.10)#27,442 |
| 35. | 63121 | 0.80% | 8.5%(-7.70)#949 | 4.9%(-4.10)#27,536 |
| 36. | 63131 | 0.60% | 8.5%(-7.90)#956 | 4.9%(-4.30)#28,330 |
| 37. | 63106 | 0.60% | 8.5%(-7.90)#957 | 4.9%(-4.30)#28,386 |
| 38. | 63101 | 0.60% | 8.5%(-7.90)#961 | 4.9%(-4.30)#28,440 |
| 39. | 63146 | 0.50% | 8.5%(-8.00)#962 | 4.9%(-4.40)#28,556 |
| 40. | 63126 | 0.40% | 8.5%(-8.10)#966 | 4.9%(-4.50)#28,988 |
| 41. | 63103 | 0.40% | 8.5%(-8.10)#967 | 4.9%(-4.50)#29,019 |
| 42. | 63135 | 0.20% | 8.5%(-8.30)#970 | 4.9%(-4.70)#29,416 |
| 43. | 63124 | 0.10% | 8.5%(-8.40)#972 | 4.9%(-4.80)#29,595 |
1
Common Questions
What are the Top 10 Zip Codes with the Highest Percentage of Households Heated by Bottled Gas / Liquid Propane in Saint Louis, MO?
Top 10 Zip Codes with the Highest Percentage of Households Heated by Bottled Gas / Liquid Propane in Saint Louis, MO are:
What zip code has the Highest Percentage of Households Heated by Bottled Gas / Liquid Propane in Saint Louis, MO?
63140 has the Highest Percentage of Households Heated by Bottled Gas / Liquid Propane in Saint Louis, MO with 3.1%.
What is the Percentage of Households Heated by Bottled Gas / Liquid Propane in Missouri?
Percentage of Households Heated by Bottled Gas / Liquid Propane in Missouri is 8.5%.
What is the Percentage of Households Heated by Bottled Gas / Liquid Propane in the United States?
Percentage of Households Heated by Bottled Gas / Liquid Propane in the United States is 4.9%.