Zip Codes with the Most Immigrants from Eastern Asia in Saint Louis, MO
RELATED REPORTS & OPTIONS
Eastern Asia
Saint Louis
Compare Zip Codes
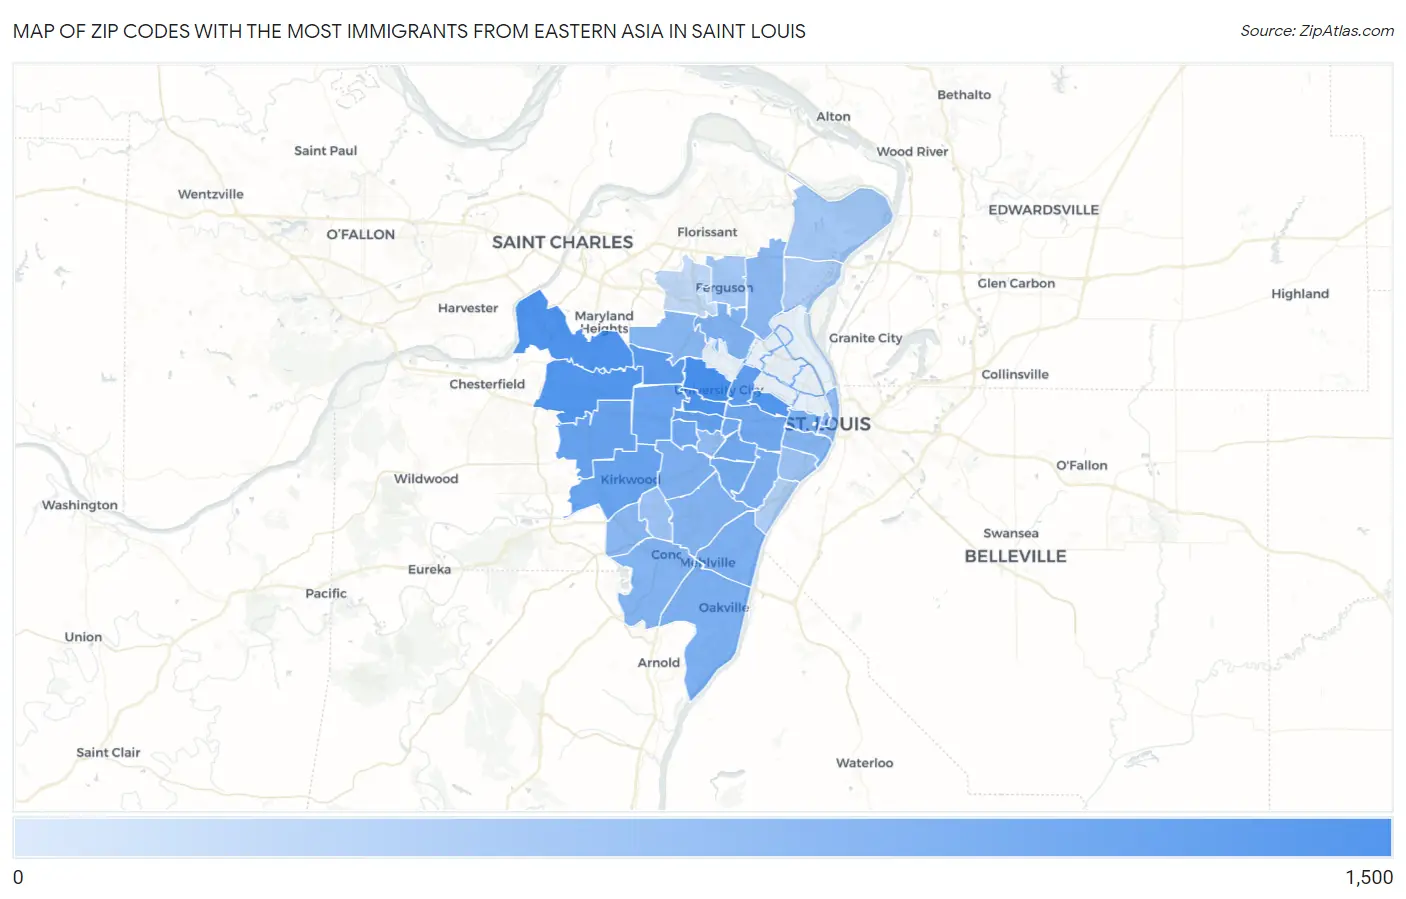
Map of Zip Codes with the Most Immigrants from Eastern Asia in Saint Louis
2
1,421
Zip Codes with the Most Immigrants from Eastern Asia in Saint Louis, MO
| Zip Code | Eastern Asia | vs State | vs National | |
| 1. | 63130 | 1,421 | 29,155(4.87%)#3 | 4,223,726(0.03%)#617 |
| 2. | 63146 | 1,023 | 29,155(3.51%)#5 | 4,223,726(0.02%)#867 |
| 3. | 63105 | 896 | 29,155(3.07%)#6 | 4,223,726(0.02%)#988 |
| 4. | 63141 | 840 | 29,155(2.88%)#7 | 4,223,726(0.02%)#1,044 |
| 5. | 63108 | 840 | 29,155(2.88%)#8 | 4,223,726(0.02%)#1,045 |
| 6. | 63132 | 553 | 29,155(1.90%)#12 | 4,223,726(0.01%)#1,579 |
| 7. | 63112 | 426 | 29,155(1.46%)#16 | 4,223,726(0.01%)#2,001 |
| 8. | 63117 | 335 | 29,155(1.15%)#19 | 4,223,726(0.01%)#2,403 |
| 9. | 63131 | 301 | 29,155(1.03%)#22 | 4,223,726(0.01%)#2,626 |
| 10. | 63122 | 255 | 29,155(0.87%)#26 | 4,223,726(0.01%)#2,985 |
| 11. | 63124 | 252 | 29,155(0.86%)#27 | 4,223,726(0.01%)#3,020 |
| 12. | 63144 | 200 | 29,155(0.69%)#31 | 4,223,726(0.00%)#3,574 |
| 13. | 63110 | 181 | 29,155(0.62%)#34 | 4,223,726(0.00%)#3,814 |
| 14. | 63139 | 170 | 29,155(0.58%)#37 | 4,223,726(0.00%)#3,961 |
| 15. | 63109 | 157 | 29,155(0.54%)#42 | 4,223,726(0.00%)#4,167 |
| 16. | 63103 | 120 | 29,155(0.41%)#52 | 4,223,726(0.00%)#4,905 |
| 17. | 63129 | 104 | 29,155(0.36%)#57 | 4,223,726(0.00%)#5,258 |
| 18. | 63116 | 98 | 29,155(0.34%)#62 | 4,223,726(0.00%)#5,411 |
| 19. | 63125 | 97 | 29,155(0.33%)#65 | 4,223,726(0.00%)#5,452 |
| 20. | 63119 | 92 | 29,155(0.32%)#69 | 4,223,726(0.00%)#5,596 |
| 21. | 63121 | 82 | 29,155(0.28%)#77 | 4,223,726(0.00%)#5,875 |
| 22. | 63123 | 80 | 29,155(0.27%)#79 | 4,223,726(0.00%)#5,934 |
| 23. | 63128 | 75 | 29,155(0.26%)#83 | 4,223,726(0.00%)#6,101 |
| 24. | 63104 | 66 | 29,155(0.23%)#93 | 4,223,726(0.00%)#6,445 |
| 25. | 63114 | 58 | 29,155(0.20%)#102 | 4,223,726(0.00%)#6,799 |
| 26. | 63127 | 52 | 29,155(0.18%)#108 | 4,223,726(0.00%)#7,129 |
| 27. | 63136 | 47 | 29,155(0.16%)#113 | 4,223,726(0.00%)#7,369 |
| 28. | 63101 | 46 | 29,155(0.16%)#116 | 4,223,726(0.00%)#7,470 |
| 29. | 63102 | 41 | 29,155(0.14%)#121 | 4,223,726(0.00%)#7,753 |
| 30. | 63143 | 40 | 29,155(0.14%)#124 | 4,223,726(0.00%)#7,801 |
| 31. | 63126 | 24 | 29,155(0.08%)#153 | 4,223,726(0.00%)#9,064 |
| 32. | 63118 | 21 | 29,155(0.07%)#162 | 4,223,726(0.00%)#9,375 |
| 33. | 63135 | 16 | 29,155(0.05%)#181 | 4,223,726(0.00%)#10,041 |
| 34. | 63138 | 15 | 29,155(0.05%)#186 | 4,223,726(0.00%)#10,191 |
| 35. | 63137 | 9 | 29,155(0.03%)#208 | 4,223,726(0.00%)#11,251 |
| 36. | 63111 | 8 | 29,155(0.03%)#215 | 4,223,726(0.00%)#11,491 |
| 37. | 63134 | 3 | 29,155(0.01%)#245 | 4,223,726(0.00%)#12,953 |
| 38. | 63140 | 2 | 29,155(0.01%)#265 | 4,223,726(0.00%)#13,622 |
1
Common Questions
What are the Top 10 Zip Codes with the Most Immigrants from Eastern Asia in Saint Louis, MO?
Top 10 Zip Codes with the Most Immigrants from Eastern Asia in Saint Louis, MO are:
What zip code has the Most Immigrants from Eastern Asia in Saint Louis, MO?
63130 has the Most Immigrants from Eastern Asia in Saint Louis, MO with 1,421.
What is the Total Immigrants from Eastern Asia in Missouri?
Total Immigrants from Eastern Asia in Missouri is 29,155.
What is the Total Immigrants from Eastern Asia in the United States?
Total Immigrants from Eastern Asia in the United States is 4,223,726.