Black/African American vs Ecuadorian Householder Income Over 65 years
COMPARE
Black/African American
Ecuadorian
Householder Income Over 65 years
Householder Income Over 65 years Comparison
Blacks/African Americans
Ecuadorians
$50,779
HOUSEHOLDER INCOME OVER 65 YEARS
0.0/ 100
METRIC RATING
329th/ 347
METRIC RANK
$54,958
HOUSEHOLDER INCOME OVER 65 YEARS
0.2/ 100
METRIC RATING
258th/ 347
METRIC RANK
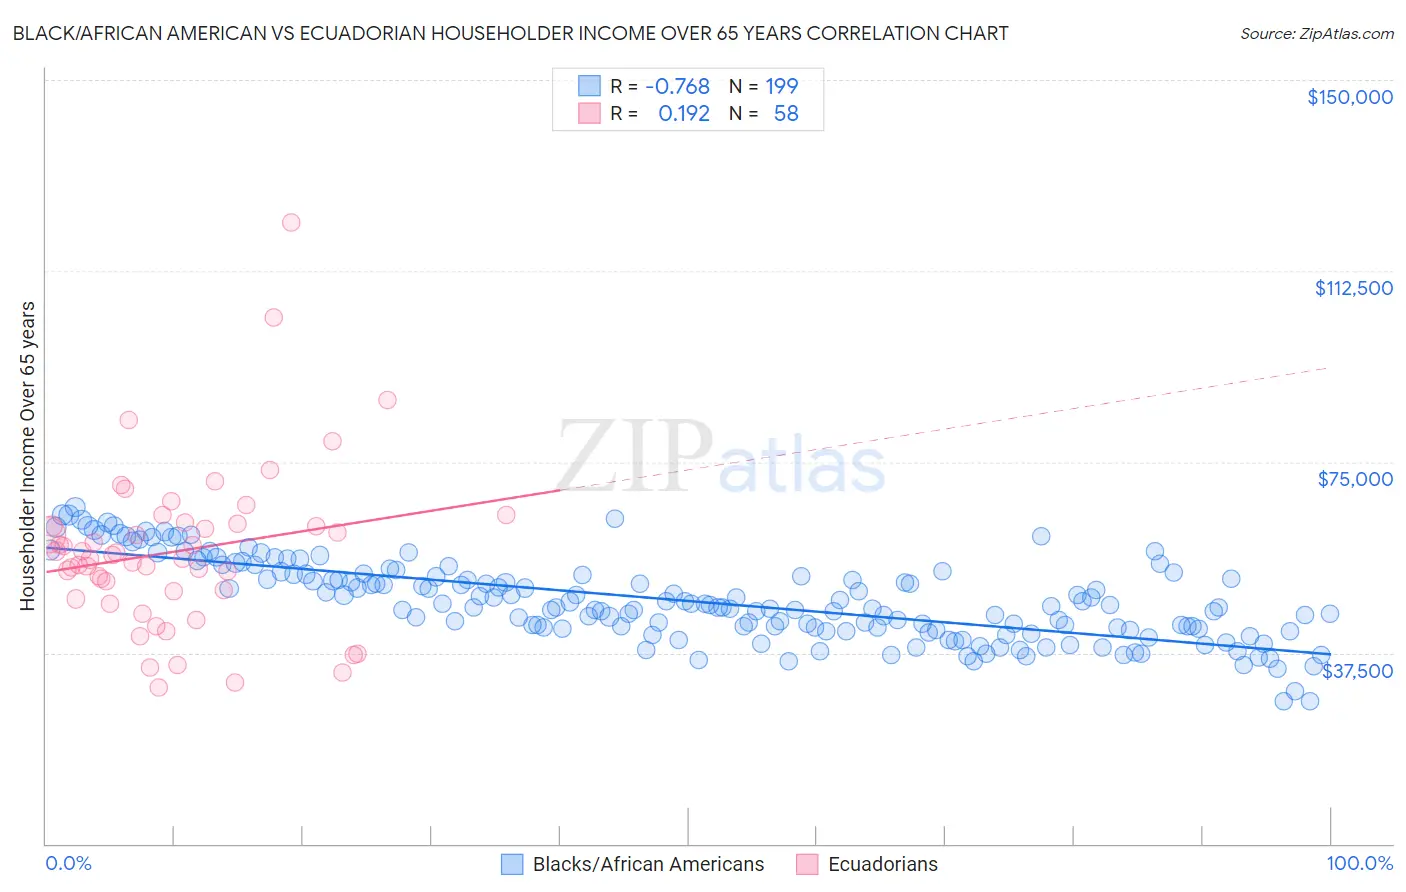
Black/African American vs Ecuadorian Householder Income Over 65 years Correlation Chart
The statistical analysis conducted on geographies consisting of 560,756,533 people shows a strong negative correlation between the proportion of Blacks/African Americans and household income with householder over the age of 65 in the United States with a correlation coefficient (R) of -0.768 and weighted average of $50,779. Similarly, the statistical analysis conducted on geographies consisting of 316,764,939 people shows a poor positive correlation between the proportion of Ecuadorians and household income with householder over the age of 65 in the United States with a correlation coefficient (R) of 0.192 and weighted average of $54,958, a difference of 8.2%.
Householder Income Over 65 years Correlation Summary
| Measurement | Black/African American | Ecuadorian |
| Minimum | $27,967 | $30,682 |
| Maximum | $66,084 | $121,912 |
| Range | $38,117 | $91,230 |
| Mean | $47,714 | $57,458 |
| Median | $46,741 | $56,254 |
| Interquartile 25% (IQ1) | $42,258 | $49,530 |
| Interquartile 75% (IQ3) | $52,943 | $62,875 |
| Interquartile Range (IQR) | $10,685 | $13,345 |
| Standard Deviation (Sample) | $7,891 | $16,134 |
| Standard Deviation (Population) | $7,872 | $15,994 |
Similar Demographics by Householder Income Over 65 years
Demographics Similar to Blacks/African Americans by Householder Income Over 65 years
In terms of householder income over 65 years, the demographic groups most similar to Blacks/African Americans are Immigrants from Grenada ($50,747, a difference of 0.060%), Hopi ($50,925, a difference of 0.29%), Bahamian ($51,000, a difference of 0.44%), Pima ($50,539, a difference of 0.47%), and Dutch West Indian ($50,475, a difference of 0.60%).
| Demographics | Rating | Rank | Householder Income Over 65 years |
| British West Indians | 0.0 /100 | #322 | Tragic $51,463 |
| Cajuns | 0.0 /100 | #323 | Tragic $51,397 |
| Immigrants | Congo | 0.0 /100 | #324 | Tragic $51,393 |
| Immigrants | Haiti | 0.0 /100 | #325 | Tragic $51,219 |
| Kiowa | 0.0 /100 | #326 | Tragic $51,140 |
| Bahamians | 0.0 /100 | #327 | Tragic $51,000 |
| Hopi | 0.0 /100 | #328 | Tragic $50,925 |
| Blacks/African Americans | 0.0 /100 | #329 | Tragic $50,779 |
| Immigrants | Grenada | 0.0 /100 | #330 | Tragic $50,747 |
| Pima | 0.0 /100 | #331 | Tragic $50,539 |
| Dutch West Indians | 0.0 /100 | #332 | Tragic $50,475 |
| Cape Verdeans | 0.0 /100 | #333 | Tragic $50,077 |
| Immigrants | Dominica | 0.0 /100 | #334 | Tragic $50,071 |
| Crow | 0.0 /100 | #335 | Tragic $49,234 |
| Cubans | 0.0 /100 | #336 | Tragic $49,152 |
Demographics Similar to Ecuadorians by Householder Income Over 65 years
In terms of householder income over 65 years, the demographic groups most similar to Ecuadorians are West Indian ($54,936, a difference of 0.040%), Immigrants from West Indies ($54,927, a difference of 0.060%), Comanche ($54,922, a difference of 0.070%), Bangladeshi ($54,719, a difference of 0.44%), and French American Indian ($54,699, a difference of 0.47%).
| Demographics | Rating | Rank | Householder Income Over 65 years |
| Immigrants | Portugal | 0.5 /100 | #251 | Tragic $55,924 |
| Osage | 0.4 /100 | #252 | Tragic $55,677 |
| Immigrants | Trinidad and Tobago | 0.4 /100 | #253 | Tragic $55,598 |
| Americans | 0.3 /100 | #254 | Tragic $55,527 |
| Immigrants | Bangladesh | 0.3 /100 | #255 | Tragic $55,394 |
| German Russians | 0.3 /100 | #256 | Tragic $55,356 |
| Trinidadians and Tobagonians | 0.3 /100 | #257 | Tragic $55,327 |
| Ecuadorians | 0.2 /100 | #258 | Tragic $54,958 |
| West Indians | 0.2 /100 | #259 | Tragic $54,936 |
| Immigrants | West Indies | 0.2 /100 | #260 | Tragic $54,927 |
| Comanche | 0.2 /100 | #261 | Tragic $54,922 |
| Bangladeshis | 0.1 /100 | #262 | Tragic $54,719 |
| French American Indians | 0.1 /100 | #263 | Tragic $54,699 |
| Apache | 0.1 /100 | #264 | Tragic $54,668 |
| Belizeans | 0.1 /100 | #265 | Tragic $54,580 |