Black/African American vs Danish Householder Income Over 65 years
COMPARE
Black/African American
Danish
Householder Income Over 65 years
Householder Income Over 65 years Comparison
Blacks/African Americans
Danes
$50,779
HOUSEHOLDER INCOME OVER 65 YEARS
0.0/ 100
METRIC RATING
329th/ 347
METRIC RANK
$63,117
HOUSEHOLDER INCOME OVER 65 YEARS
90.5/ 100
METRIC RATING
118th/ 347
METRIC RANK
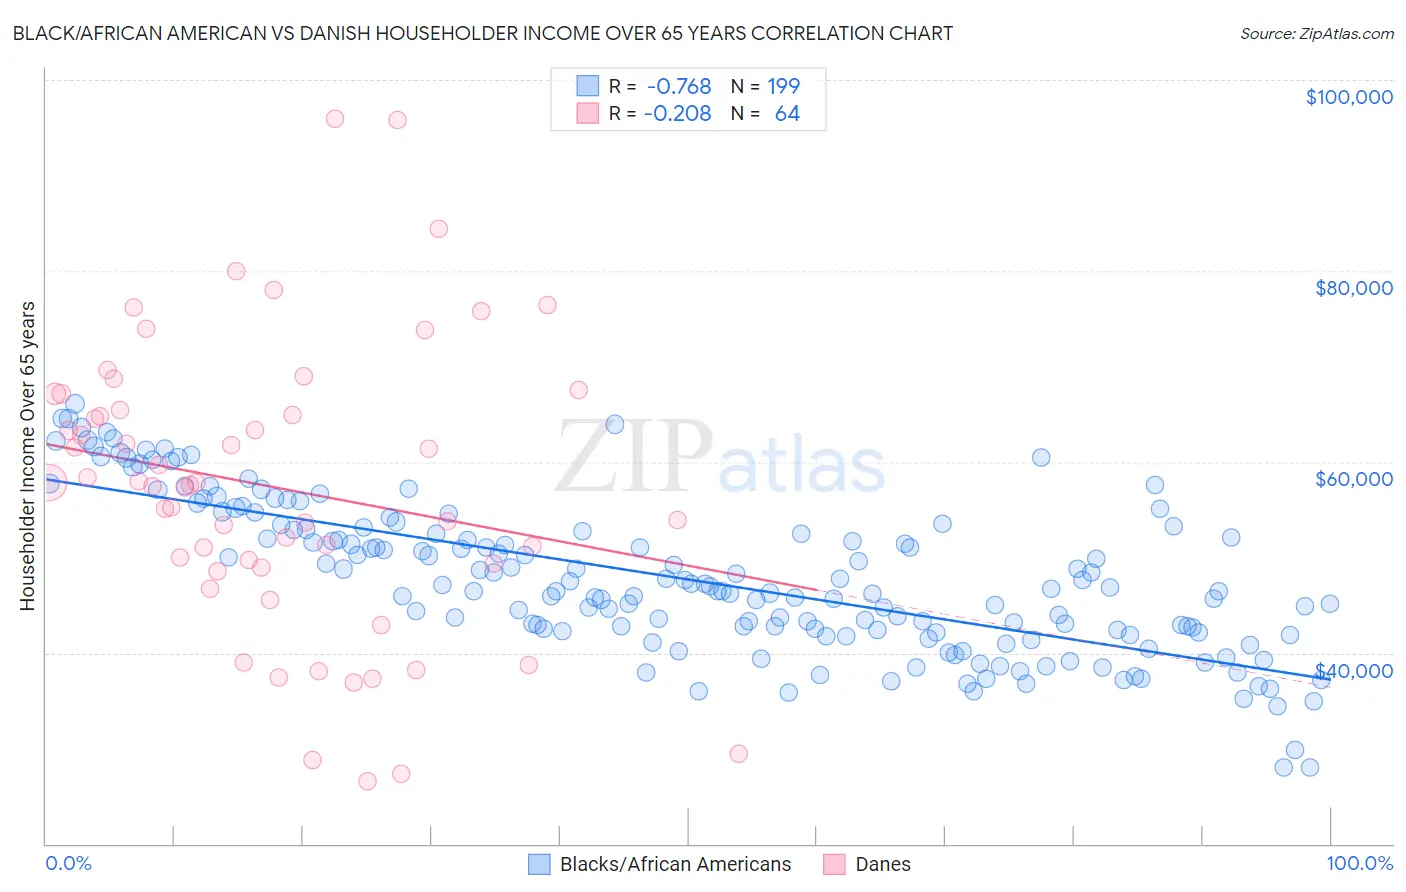
Black/African American vs Danish Householder Income Over 65 years Correlation Chart
The statistical analysis conducted on geographies consisting of 560,756,533 people shows a strong negative correlation between the proportion of Blacks/African Americans and household income with householder over the age of 65 in the United States with a correlation coefficient (R) of -0.768 and weighted average of $50,779. Similarly, the statistical analysis conducted on geographies consisting of 471,993,582 people shows a weak negative correlation between the proportion of Danes and household income with householder over the age of 65 in the United States with a correlation coefficient (R) of -0.208 and weighted average of $63,117, a difference of 24.3%.
Householder Income Over 65 years Correlation Summary
| Measurement | Black/African American | Danish |
| Minimum | $27,967 | $26,500 |
| Maximum | $66,084 | $95,917 |
| Range | $38,117 | $69,417 |
| Mean | $47,714 | $57,329 |
| Median | $46,741 | $57,701 |
| Interquartile 25% (IQ1) | $42,258 | $49,152 |
| Interquartile 75% (IQ3) | $52,943 | $66,265 |
| Interquartile Range (IQR) | $10,685 | $17,112 |
| Standard Deviation (Sample) | $7,891 | $15,144 |
| Standard Deviation (Population) | $7,872 | $15,025 |
Similar Demographics by Householder Income Over 65 years
Demographics Similar to Blacks/African Americans by Householder Income Over 65 years
In terms of householder income over 65 years, the demographic groups most similar to Blacks/African Americans are Immigrants from Grenada ($50,747, a difference of 0.060%), Hopi ($50,925, a difference of 0.29%), Bahamian ($51,000, a difference of 0.44%), Pima ($50,539, a difference of 0.47%), and Dutch West Indian ($50,475, a difference of 0.60%).
| Demographics | Rating | Rank | Householder Income Over 65 years |
| British West Indians | 0.0 /100 | #322 | Tragic $51,463 |
| Cajuns | 0.0 /100 | #323 | Tragic $51,397 |
| Immigrants | Congo | 0.0 /100 | #324 | Tragic $51,393 |
| Immigrants | Haiti | 0.0 /100 | #325 | Tragic $51,219 |
| Kiowa | 0.0 /100 | #326 | Tragic $51,140 |
| Bahamians | 0.0 /100 | #327 | Tragic $51,000 |
| Hopi | 0.0 /100 | #328 | Tragic $50,925 |
| Blacks/African Americans | 0.0 /100 | #329 | Tragic $50,779 |
| Immigrants | Grenada | 0.0 /100 | #330 | Tragic $50,747 |
| Pima | 0.0 /100 | #331 | Tragic $50,539 |
| Dutch West Indians | 0.0 /100 | #332 | Tragic $50,475 |
| Cape Verdeans | 0.0 /100 | #333 | Tragic $50,077 |
| Immigrants | Dominica | 0.0 /100 | #334 | Tragic $50,071 |
| Crow | 0.0 /100 | #335 | Tragic $49,234 |
| Cubans | 0.0 /100 | #336 | Tragic $49,152 |
Demographics Similar to Danes by Householder Income Over 65 years
In terms of householder income over 65 years, the demographic groups most similar to Danes are Immigrants from Croatia ($63,168, a difference of 0.080%), Guamanian/Chamorro ($63,187, a difference of 0.11%), Immigrants from Jordan ($63,041, a difference of 0.12%), Ukrainian ($63,032, a difference of 0.13%), and Immigrants from Vietnam ($63,014, a difference of 0.16%).
| Demographics | Rating | Rank | Householder Income Over 65 years |
| Immigrants | Spain | 93.7 /100 | #111 | Exceptional $63,540 |
| Syrians | 93.4 /100 | #112 | Exceptional $63,494 |
| Immigrants | Serbia | 92.7 /100 | #113 | Exceptional $63,387 |
| Immigrants | Saudi Arabia | 92.4 /100 | #114 | Exceptional $63,355 |
| Croatians | 91.4 /100 | #115 | Exceptional $63,225 |
| Guamanians/Chamorros | 91.1 /100 | #116 | Exceptional $63,187 |
| Immigrants | Croatia | 90.9 /100 | #117 | Exceptional $63,168 |
| Danes | 90.5 /100 | #118 | Exceptional $63,117 |
| Immigrants | Jordan | 89.8 /100 | #119 | Excellent $63,041 |
| Ukrainians | 89.7 /100 | #120 | Excellent $63,032 |
| Immigrants | Vietnam | 89.5 /100 | #121 | Excellent $63,014 |
| Immigrants | Moldova | 88.7 /100 | #122 | Excellent $62,939 |
| Tlingit-Haida | 88.6 /100 | #123 | Excellent $62,922 |
| Taiwanese | 88.3 /100 | #124 | Excellent $62,894 |
| Soviet Union | 87.8 /100 | #125 | Excellent $62,848 |