Black/African American vs Ecuadorian Births to Unmarried Women
COMPARE
Black/African American
Ecuadorian
Births to Unmarried Women
Births to Unmarried Women Comparison
Blacks/African Americans
Ecuadorians
44.3%
BIRTHS TO UNMARRIED WOMEN
0.0/ 100
METRIC RATING
333rd/ 347
METRIC RANK
33.3%
BIRTHS TO UNMARRIED WOMEN
10.5/ 100
METRIC RATING
211th/ 347
METRIC RANK
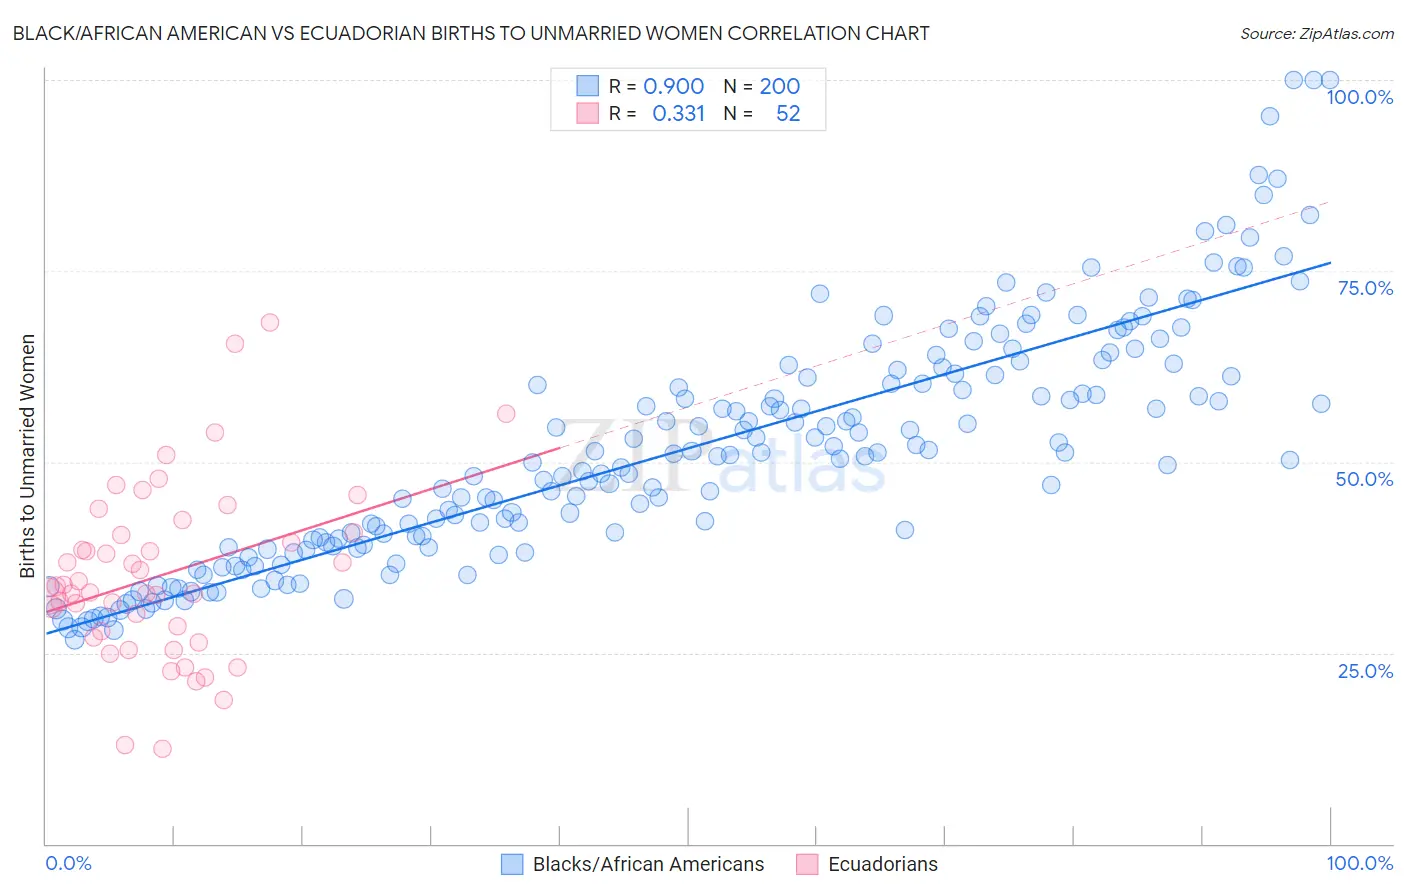
Black/African American vs Ecuadorian Births to Unmarried Women Correlation Chart
The statistical analysis conducted on geographies consisting of 506,152,506 people shows a very strong positive correlation between the proportion of Blacks/African Americans and percentage of births to unmarried women in the United States with a correlation coefficient (R) of 0.900 and weighted average of 44.3%. Similarly, the statistical analysis conducted on geographies consisting of 300,726,329 people shows a mild positive correlation between the proportion of Ecuadorians and percentage of births to unmarried women in the United States with a correlation coefficient (R) of 0.331 and weighted average of 33.3%, a difference of 33.1%.
Births to Unmarried Women Correlation Summary
| Measurement | Black/African American | Ecuadorian |
| Minimum | 26.7% | 12.5% |
| Maximum | 100.0% | 68.3% |
| Range | 73.3% | 55.8% |
| Mean | 51.8% | 35.1% |
| Median | 50.9% | 33.3% |
| Interquartile 25% (IQ1) | 39.1% | 27.4% |
| Interquartile 75% (IQ3) | 61.4% | 40.6% |
| Interquartile Range (IQR) | 22.4% | 13.2% |
| Standard Deviation (Sample) | 15.6% | 11.5% |
| Standard Deviation (Population) | 15.6% | 11.3% |
Similar Demographics by Births to Unmarried Women
Demographics Similar to Blacks/African Americans by Births to Unmarried Women
In terms of births to unmarried women, the demographic groups most similar to Blacks/African Americans are Yuman (44.4%, a difference of 0.17%), Colville (45.3%, a difference of 2.3%), Kiowa (43.1%, a difference of 2.7%), Native/Alaskan (43.0%, a difference of 3.0%), and Puerto Rican (45.7%, a difference of 3.1%).
| Demographics | Rating | Rank | Births to Unmarried Women |
| Immigrants | Cuba | 0.0 /100 | #326 | Tragic 41.5% |
| Tsimshian | 0.0 /100 | #327 | Tragic 42.2% |
| Immigrants | Cabo Verde | 0.0 /100 | #328 | Tragic 42.2% |
| Paiute | 0.0 /100 | #329 | Tragic 42.5% |
| Chippewa | 0.0 /100 | #330 | Tragic 42.6% |
| Natives/Alaskans | 0.0 /100 | #331 | Tragic 43.0% |
| Kiowa | 0.0 /100 | #332 | Tragic 43.1% |
| Blacks/African Americans | 0.0 /100 | #333 | Tragic 44.3% |
| Yuman | 0.0 /100 | #334 | Tragic 44.4% |
| Colville | 0.0 /100 | #335 | Tragic 45.3% |
| Puerto Ricans | 0.0 /100 | #336 | Tragic 45.7% |
| Houma | 0.0 /100 | #337 | Tragic 46.6% |
| Arapaho | 0.0 /100 | #338 | Tragic 47.1% |
| Lumbee | 0.0 /100 | #339 | Tragic 48.2% |
| Tohono O'odham | 0.0 /100 | #340 | Tragic 49.8% |
Demographics Similar to Ecuadorians by Births to Unmarried Women
In terms of births to unmarried women, the demographic groups most similar to Ecuadorians are White/Caucasian (33.3%, a difference of 0.050%), Scotch-Irish (33.3%, a difference of 0.050%), Celtic (33.3%, a difference of 0.070%), Hawaiian (33.2%, a difference of 0.19%), and Immigrants from Sudan (33.2%, a difference of 0.22%).
| Demographics | Rating | Rank | Births to Unmarried Women |
| Immigrants | Africa | 14.3 /100 | #204 | Poor 33.0% |
| German Russians | 13.1 /100 | #205 | Poor 33.1% |
| Uruguayans | 12.8 /100 | #206 | Poor 33.1% |
| Immigrants | Sudan | 11.5 /100 | #207 | Poor 33.2% |
| Hawaiians | 11.3 /100 | #208 | Poor 33.2% |
| Whites/Caucasians | 10.7 /100 | #209 | Poor 33.3% |
| Scotch-Irish | 10.7 /100 | #210 | Poor 33.3% |
| Ecuadorians | 10.5 /100 | #211 | Poor 33.3% |
| Celtics | 10.2 /100 | #212 | Poor 33.3% |
| Immigrants | Costa Rica | 9.5 /100 | #213 | Tragic 33.4% |
| Slovaks | 9.3 /100 | #214 | Tragic 33.4% |
| French | 8.7 /100 | #215 | Tragic 33.4% |
| Nepalese | 7.8 /100 | #216 | Tragic 33.5% |
| Spaniards | 7.0 /100 | #217 | Tragic 33.6% |
| Immigrants | Ecuador | 5.9 /100 | #218 | Tragic 33.7% |