Black/African American vs European Householder Income Over 65 years
COMPARE
Black/African American
European
Householder Income Over 65 years
Householder Income Over 65 years Comparison
Blacks/African Americans
Europeans
$50,779
HOUSEHOLDER INCOME OVER 65 YEARS
0.0/ 100
METRIC RATING
329th/ 347
METRIC RANK
$63,779
HOUSEHOLDER INCOME OVER 65 YEARS
95.0/ 100
METRIC RATING
109th/ 347
METRIC RANK
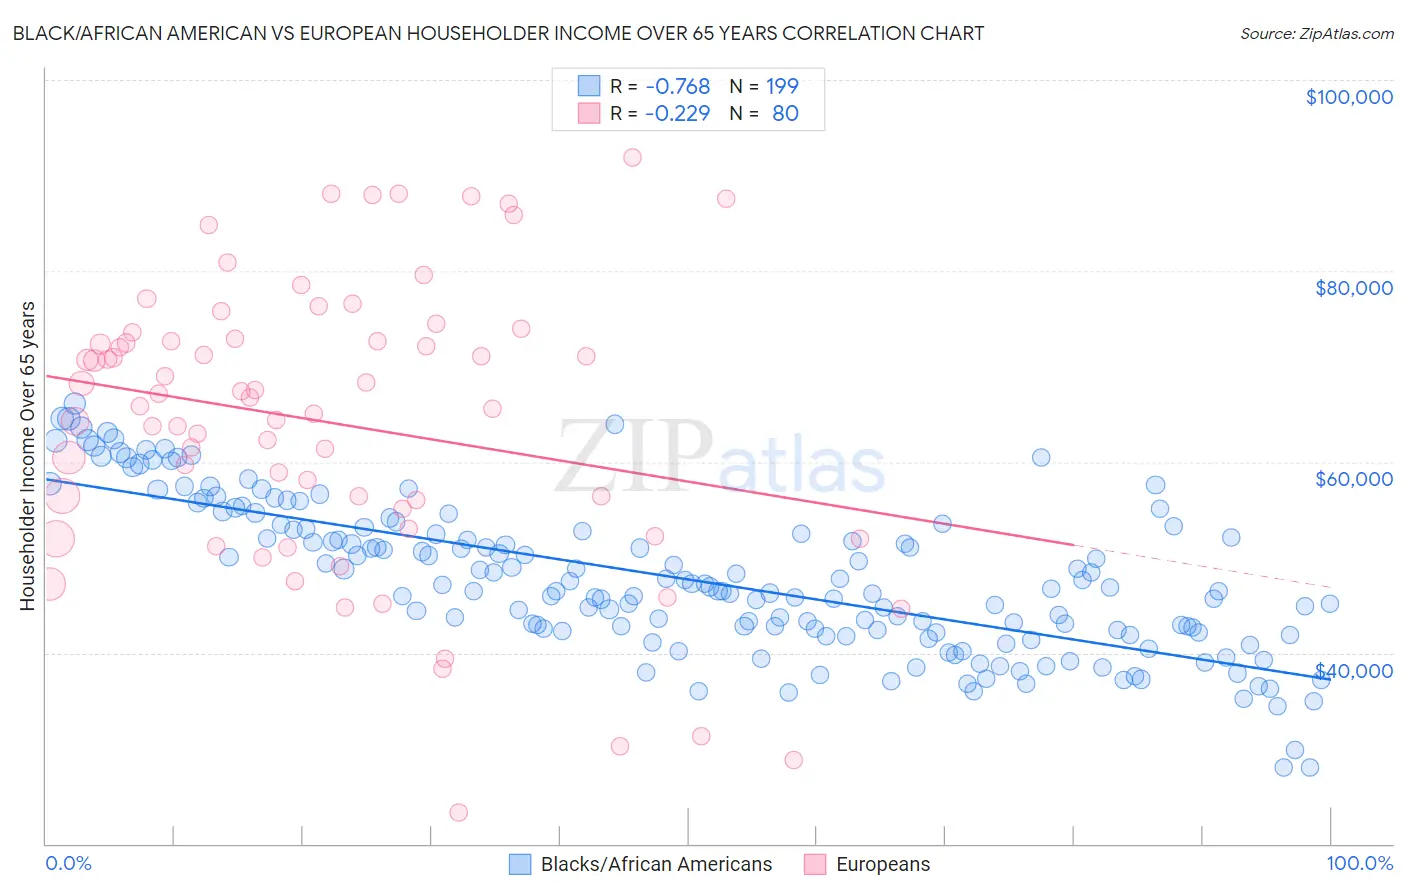
Black/African American vs European Householder Income Over 65 years Correlation Chart
The statistical analysis conducted on geographies consisting of 560,756,533 people shows a strong negative correlation between the proportion of Blacks/African Americans and household income with householder over the age of 65 in the United States with a correlation coefficient (R) of -0.768 and weighted average of $50,779. Similarly, the statistical analysis conducted on geographies consisting of 557,215,032 people shows a weak negative correlation between the proportion of Europeans and household income with householder over the age of 65 in the United States with a correlation coefficient (R) of -0.229 and weighted average of $63,779, a difference of 25.6%.
Householder Income Over 65 years Correlation Summary
| Measurement | Black/African American | European |
| Minimum | $27,967 | $23,269 |
| Maximum | $66,084 | $91,861 |
| Range | $38,117 | $68,592 |
| Mean | $47,714 | $64,098 |
| Median | $46,741 | $66,247 |
| Interquartile 25% (IQ1) | $42,258 | $54,019 |
| Interquartile 75% (IQ3) | $52,943 | $72,739 |
| Interquartile Range (IQR) | $10,685 | $18,720 |
| Standard Deviation (Sample) | $7,891 | $14,994 |
| Standard Deviation (Population) | $7,872 | $14,900 |
Similar Demographics by Householder Income Over 65 years
Demographics Similar to Blacks/African Americans by Householder Income Over 65 years
In terms of householder income over 65 years, the demographic groups most similar to Blacks/African Americans are Immigrants from Grenada ($50,747, a difference of 0.060%), Hopi ($50,925, a difference of 0.29%), Bahamian ($51,000, a difference of 0.44%), Pima ($50,539, a difference of 0.47%), and Dutch West Indian ($50,475, a difference of 0.60%).
| Demographics | Rating | Rank | Householder Income Over 65 years |
| British West Indians | 0.0 /100 | #322 | Tragic $51,463 |
| Cajuns | 0.0 /100 | #323 | Tragic $51,397 |
| Immigrants | Congo | 0.0 /100 | #324 | Tragic $51,393 |
| Immigrants | Haiti | 0.0 /100 | #325 | Tragic $51,219 |
| Kiowa | 0.0 /100 | #326 | Tragic $51,140 |
| Bahamians | 0.0 /100 | #327 | Tragic $51,000 |
| Hopi | 0.0 /100 | #328 | Tragic $50,925 |
| Blacks/African Americans | 0.0 /100 | #329 | Tragic $50,779 |
| Immigrants | Grenada | 0.0 /100 | #330 | Tragic $50,747 |
| Pima | 0.0 /100 | #331 | Tragic $50,539 |
| Dutch West Indians | 0.0 /100 | #332 | Tragic $50,475 |
| Cape Verdeans | 0.0 /100 | #333 | Tragic $50,077 |
| Immigrants | Dominica | 0.0 /100 | #334 | Tragic $50,071 |
| Crow | 0.0 /100 | #335 | Tragic $49,234 |
| Cubans | 0.0 /100 | #336 | Tragic $49,152 |
Demographics Similar to Europeans by Householder Income Over 65 years
In terms of householder income over 65 years, the demographic groups most similar to Europeans are Palestinian ($63,800, a difference of 0.030%), Pakistani ($63,844, a difference of 0.10%), Italian ($63,885, a difference of 0.17%), Immigrants from Argentina ($63,885, a difference of 0.17%), and Immigrants from Cameroon ($63,907, a difference of 0.20%).
| Demographics | Rating | Rank | Householder Income Over 65 years |
| Chileans | 95.8 /100 | #102 | Exceptional $63,957 |
| British | 95.7 /100 | #103 | Exceptional $63,940 |
| Immigrants | Cameroon | 95.6 /100 | #104 | Exceptional $63,907 |
| Italians | 95.5 /100 | #105 | Exceptional $63,885 |
| Immigrants | Argentina | 95.5 /100 | #106 | Exceptional $63,885 |
| Pakistanis | 95.3 /100 | #107 | Exceptional $63,844 |
| Palestinians | 95.1 /100 | #108 | Exceptional $63,800 |
| Europeans | 95.0 /100 | #109 | Exceptional $63,779 |
| Immigrants | Zimbabwe | 94.3 /100 | #110 | Exceptional $63,643 |
| Immigrants | Spain | 93.7 /100 | #111 | Exceptional $63,540 |
| Syrians | 93.4 /100 | #112 | Exceptional $63,494 |
| Immigrants | Serbia | 92.7 /100 | #113 | Exceptional $63,387 |
| Immigrants | Saudi Arabia | 92.4 /100 | #114 | Exceptional $63,355 |
| Croatians | 91.4 /100 | #115 | Exceptional $63,225 |
| Guamanians/Chamorros | 91.1 /100 | #116 | Exceptional $63,187 |