Black/African American vs Pueblo Householder Income Over 65 years
COMPARE
Black/African American
Pueblo
Householder Income Over 65 years
Householder Income Over 65 years Comparison
Blacks/African Americans
Pueblo
$50,779
HOUSEHOLDER INCOME OVER 65 YEARS
0.0/ 100
METRIC RATING
329th/ 347
METRIC RANK
$52,930
HOUSEHOLDER INCOME OVER 65 YEARS
0.0/ 100
METRIC RATING
305th/ 347
METRIC RANK
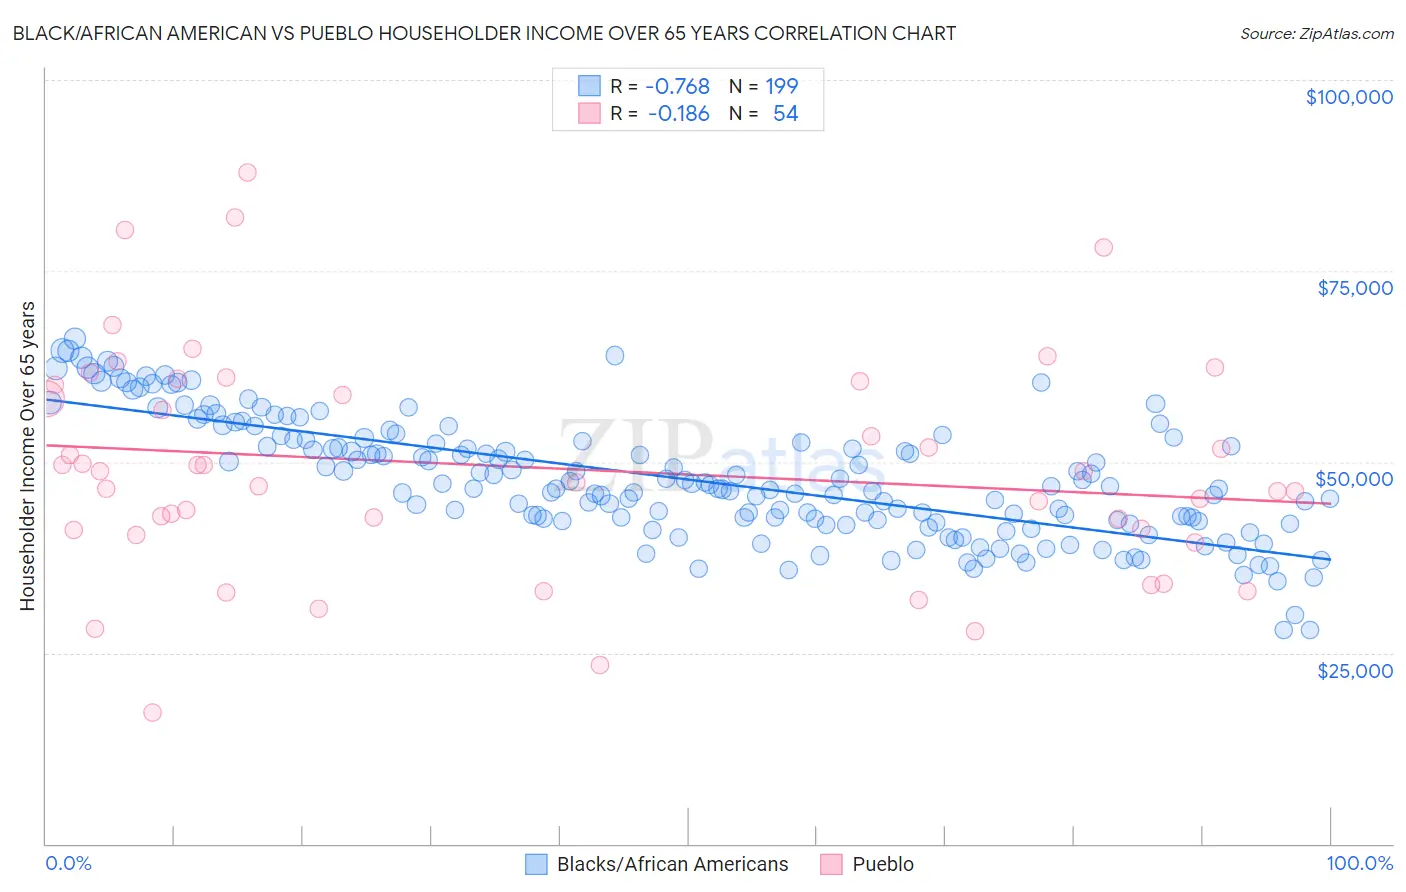
Black/African American vs Pueblo Householder Income Over 65 years Correlation Chart
The statistical analysis conducted on geographies consisting of 560,756,533 people shows a strong negative correlation between the proportion of Blacks/African Americans and household income with householder over the age of 65 in the United States with a correlation coefficient (R) of -0.768 and weighted average of $50,779. Similarly, the statistical analysis conducted on geographies consisting of 119,861,593 people shows a poor negative correlation between the proportion of Pueblo and household income with householder over the age of 65 in the United States with a correlation coefficient (R) of -0.186 and weighted average of $52,930, a difference of 4.2%.
Householder Income Over 65 years Correlation Summary
| Measurement | Black/African American | Pueblo |
| Minimum | $27,967 | $17,188 |
| Maximum | $66,084 | $87,917 |
| Range | $38,117 | $70,729 |
| Mean | $47,714 | $49,255 |
| Median | $46,741 | $48,042 |
| Interquartile 25% (IQ1) | $42,258 | $41,107 |
| Interquartile 75% (IQ3) | $52,943 | $60,136 |
| Interquartile Range (IQR) | $10,685 | $19,029 |
| Standard Deviation (Sample) | $7,891 | $14,756 |
| Standard Deviation (Population) | $7,872 | $14,619 |
Similar Demographics by Householder Income Over 65 years
Demographics Similar to Blacks/African Americans by Householder Income Over 65 years
In terms of householder income over 65 years, the demographic groups most similar to Blacks/African Americans are Immigrants from Grenada ($50,747, a difference of 0.060%), Hopi ($50,925, a difference of 0.29%), Bahamian ($51,000, a difference of 0.44%), Pima ($50,539, a difference of 0.47%), and Dutch West Indian ($50,475, a difference of 0.60%).
| Demographics | Rating | Rank | Householder Income Over 65 years |
| British West Indians | 0.0 /100 | #322 | Tragic $51,463 |
| Cajuns | 0.0 /100 | #323 | Tragic $51,397 |
| Immigrants | Congo | 0.0 /100 | #324 | Tragic $51,393 |
| Immigrants | Haiti | 0.0 /100 | #325 | Tragic $51,219 |
| Kiowa | 0.0 /100 | #326 | Tragic $51,140 |
| Bahamians | 0.0 /100 | #327 | Tragic $51,000 |
| Hopi | 0.0 /100 | #328 | Tragic $50,925 |
| Blacks/African Americans | 0.0 /100 | #329 | Tragic $50,779 |
| Immigrants | Grenada | 0.0 /100 | #330 | Tragic $50,747 |
| Pima | 0.0 /100 | #331 | Tragic $50,539 |
| Dutch West Indians | 0.0 /100 | #332 | Tragic $50,475 |
| Cape Verdeans | 0.0 /100 | #333 | Tragic $50,077 |
| Immigrants | Dominica | 0.0 /100 | #334 | Tragic $50,071 |
| Crow | 0.0 /100 | #335 | Tragic $49,234 |
| Cubans | 0.0 /100 | #336 | Tragic $49,152 |
Demographics Similar to Pueblo by Householder Income Over 65 years
In terms of householder income over 65 years, the demographic groups most similar to Pueblo are Ute ($52,949, a difference of 0.040%), Pennsylvania German ($52,888, a difference of 0.080%), Hispanic or Latino ($52,832, a difference of 0.19%), Immigrants from Mexico ($52,801, a difference of 0.24%), and Choctaw ($53,060, a difference of 0.25%).
| Demographics | Rating | Rank | Householder Income Over 65 years |
| Central American Indians | 0.0 /100 | #298 | Tragic $53,232 |
| Ottawa | 0.0 /100 | #299 | Tragic $53,217 |
| Immigrants | Bahamas | 0.0 /100 | #300 | Tragic $53,174 |
| Yuman | 0.0 /100 | #301 | Tragic $53,110 |
| Spanish American Indians | 0.0 /100 | #302 | Tragic $53,077 |
| Choctaw | 0.0 /100 | #303 | Tragic $53,060 |
| Ute | 0.0 /100 | #304 | Tragic $52,949 |
| Pueblo | 0.0 /100 | #305 | Tragic $52,930 |
| Pennsylvania Germans | 0.0 /100 | #306 | Tragic $52,888 |
| Hispanics or Latinos | 0.0 /100 | #307 | Tragic $52,832 |
| Immigrants | Mexico | 0.0 /100 | #308 | Tragic $52,801 |
| Hondurans | 0.0 /100 | #309 | Tragic $52,634 |
| Sioux | 0.0 /100 | #310 | Tragic $52,509 |
| Seminole | 0.0 /100 | #311 | Tragic $52,373 |
| Immigrants | Azores | 0.0 /100 | #312 | Tragic $52,121 |