Black/African American vs Belgian Householder Income Over 65 years
COMPARE
Black/African American
Belgian
Householder Income Over 65 years
Householder Income Over 65 years Comparison
Blacks/African Americans
Belgians
$50,779
HOUSEHOLDER INCOME OVER 65 YEARS
0.0/ 100
METRIC RATING
329th/ 347
METRIC RANK
$59,915
HOUSEHOLDER INCOME OVER 65 YEARS
24.9/ 100
METRIC RATING
191st/ 347
METRIC RANK
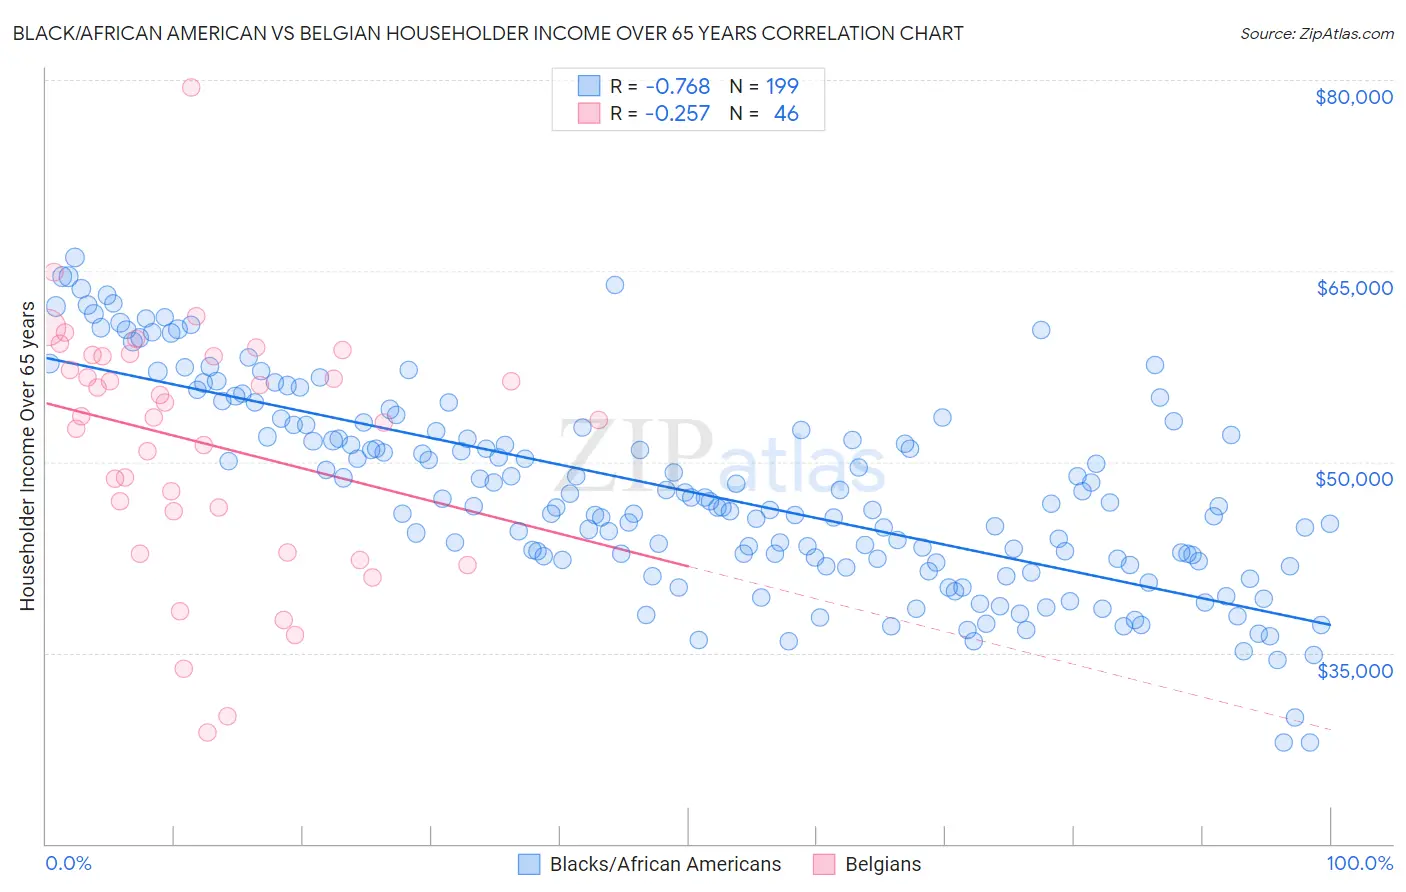
Black/African American vs Belgian Householder Income Over 65 years Correlation Chart
The statistical analysis conducted on geographies consisting of 560,756,533 people shows a strong negative correlation between the proportion of Blacks/African Americans and household income with householder over the age of 65 in the United States with a correlation coefficient (R) of -0.768 and weighted average of $50,779. Similarly, the statistical analysis conducted on geographies consisting of 355,085,378 people shows a weak negative correlation between the proportion of Belgians and household income with householder over the age of 65 in the United States with a correlation coefficient (R) of -0.257 and weighted average of $59,915, a difference of 18.0%.
Householder Income Over 65 years Correlation Summary
| Measurement | Black/African American | Belgian |
| Minimum | $27,967 | $28,750 |
| Maximum | $66,084 | $79,412 |
| Range | $38,117 | $50,662 |
| Mean | $47,714 | $51,516 |
| Median | $46,741 | $53,553 |
| Interquartile 25% (IQ1) | $42,258 | $46,134 |
| Interquartile 75% (IQ3) | $52,943 | $58,281 |
| Interquartile Range (IQR) | $10,685 | $12,147 |
| Standard Deviation (Sample) | $7,891 | $9,760 |
| Standard Deviation (Population) | $7,872 | $9,654 |
Similar Demographics by Householder Income Over 65 years
Demographics Similar to Blacks/African Americans by Householder Income Over 65 years
In terms of householder income over 65 years, the demographic groups most similar to Blacks/African Americans are Immigrants from Grenada ($50,747, a difference of 0.060%), Hopi ($50,925, a difference of 0.29%), Bahamian ($51,000, a difference of 0.44%), Pima ($50,539, a difference of 0.47%), and Dutch West Indian ($50,475, a difference of 0.60%).
| Demographics | Rating | Rank | Householder Income Over 65 years |
| British West Indians | 0.0 /100 | #322 | Tragic $51,463 |
| Cajuns | 0.0 /100 | #323 | Tragic $51,397 |
| Immigrants | Congo | 0.0 /100 | #324 | Tragic $51,393 |
| Immigrants | Haiti | 0.0 /100 | #325 | Tragic $51,219 |
| Kiowa | 0.0 /100 | #326 | Tragic $51,140 |
| Bahamians | 0.0 /100 | #327 | Tragic $51,000 |
| Hopi | 0.0 /100 | #328 | Tragic $50,925 |
| Blacks/African Americans | 0.0 /100 | #329 | Tragic $50,779 |
| Immigrants | Grenada | 0.0 /100 | #330 | Tragic $50,747 |
| Pima | 0.0 /100 | #331 | Tragic $50,539 |
| Dutch West Indians | 0.0 /100 | #332 | Tragic $50,475 |
| Cape Verdeans | 0.0 /100 | #333 | Tragic $50,077 |
| Immigrants | Dominica | 0.0 /100 | #334 | Tragic $50,071 |
| Crow | 0.0 /100 | #335 | Tragic $49,234 |
| Cubans | 0.0 /100 | #336 | Tragic $49,152 |
Demographics Similar to Belgians by Householder Income Over 65 years
In terms of householder income over 65 years, the demographic groups most similar to Belgians are Puget Sound Salish ($59,934, a difference of 0.030%), South American ($59,854, a difference of 0.10%), Immigrants from Costa Rica ($59,848, a difference of 0.11%), Immigrants from Africa ($59,837, a difference of 0.13%), and Immigrants from Iraq ($59,824, a difference of 0.15%).
| Demographics | Rating | Rank | Householder Income Over 65 years |
| Iraqis | 37.2 /100 | #184 | Fair $60,466 |
| Albanians | 32.0 /100 | #185 | Fair $60,249 |
| Slovenes | 31.8 /100 | #186 | Fair $60,241 |
| Immigrants | Thailand | 31.3 /100 | #187 | Fair $60,217 |
| Immigrants | Eritrea | 28.6 /100 | #188 | Fair $60,096 |
| Ghanaians | 27.5 /100 | #189 | Fair $60,043 |
| Puget Sound Salish | 25.3 /100 | #190 | Fair $59,934 |
| Belgians | 24.9 /100 | #191 | Fair $59,915 |
| South Americans | 23.8 /100 | #192 | Fair $59,854 |
| Immigrants | Costa Rica | 23.6 /100 | #193 | Fair $59,848 |
| Immigrants | Africa | 23.4 /100 | #194 | Fair $59,837 |
| Immigrants | Iraq | 23.2 /100 | #195 | Fair $59,824 |
| Germans | 21.5 /100 | #196 | Fair $59,730 |
| Immigrants | Kenya | 21.1 /100 | #197 | Fair $59,710 |
| Moroccans | 20.7 /100 | #198 | Fair $59,683 |