Black/African American vs Somali Householder Income Over 65 years
COMPARE
Black/African American
Somali
Householder Income Over 65 years
Householder Income Over 65 years Comparison
Blacks/African Americans
Somalis
$50,779
HOUSEHOLDER INCOME OVER 65 YEARS
0.0/ 100
METRIC RATING
329th/ 347
METRIC RANK
$54,004
HOUSEHOLDER INCOME OVER 65 YEARS
0.1/ 100
METRIC RATING
281st/ 347
METRIC RANK
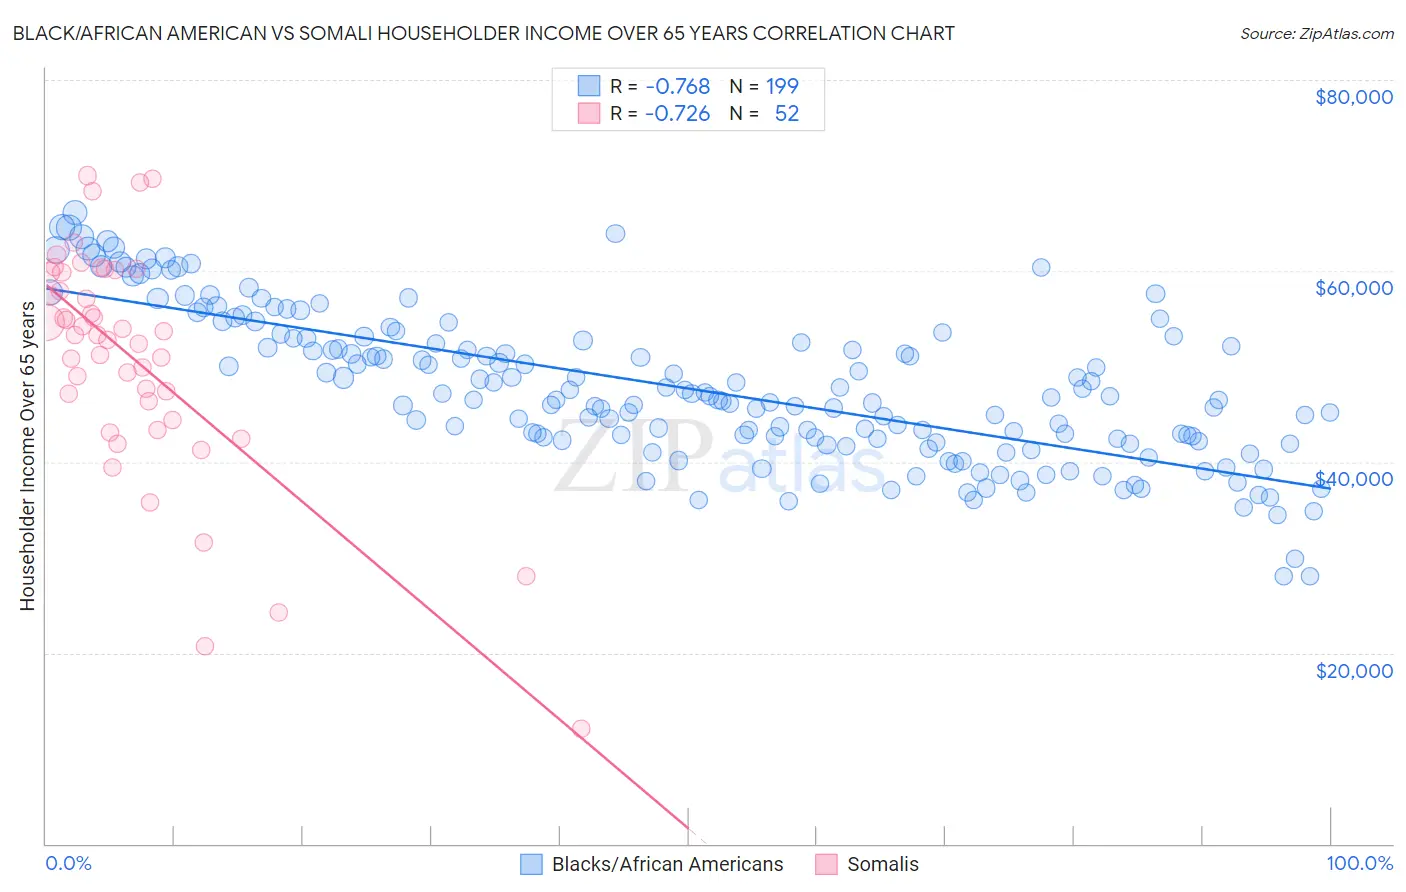
Black/African American vs Somali Householder Income Over 65 years Correlation Chart
The statistical analysis conducted on geographies consisting of 560,756,533 people shows a strong negative correlation between the proportion of Blacks/African Americans and household income with householder over the age of 65 in the United States with a correlation coefficient (R) of -0.768 and weighted average of $50,779. Similarly, the statistical analysis conducted on geographies consisting of 99,125,363 people shows a strong negative correlation between the proportion of Somalis and household income with householder over the age of 65 in the United States with a correlation coefficient (R) of -0.726 and weighted average of $54,004, a difference of 6.4%.
Householder Income Over 65 years Correlation Summary
| Measurement | Black/African American | Somali |
| Minimum | $27,967 | $12,049 |
| Maximum | $66,084 | $69,985 |
| Range | $38,117 | $57,936 |
| Mean | $47,714 | $50,826 |
| Median | $46,741 | $53,340 |
| Interquartile 25% (IQ1) | $42,258 | $45,352 |
| Interquartile 75% (IQ3) | $52,943 | $59,867 |
| Interquartile Range (IQR) | $10,685 | $14,515 |
| Standard Deviation (Sample) | $7,891 | $12,083 |
| Standard Deviation (Population) | $7,872 | $11,967 |
Similar Demographics by Householder Income Over 65 years
Demographics Similar to Blacks/African Americans by Householder Income Over 65 years
In terms of householder income over 65 years, the demographic groups most similar to Blacks/African Americans are Immigrants from Grenada ($50,747, a difference of 0.060%), Hopi ($50,925, a difference of 0.29%), Bahamian ($51,000, a difference of 0.44%), Pima ($50,539, a difference of 0.47%), and Dutch West Indian ($50,475, a difference of 0.60%).
| Demographics | Rating | Rank | Householder Income Over 65 years |
| British West Indians | 0.0 /100 | #322 | Tragic $51,463 |
| Cajuns | 0.0 /100 | #323 | Tragic $51,397 |
| Immigrants | Congo | 0.0 /100 | #324 | Tragic $51,393 |
| Immigrants | Haiti | 0.0 /100 | #325 | Tragic $51,219 |
| Kiowa | 0.0 /100 | #326 | Tragic $51,140 |
| Bahamians | 0.0 /100 | #327 | Tragic $51,000 |
| Hopi | 0.0 /100 | #328 | Tragic $50,925 |
| Blacks/African Americans | 0.0 /100 | #329 | Tragic $50,779 |
| Immigrants | Grenada | 0.0 /100 | #330 | Tragic $50,747 |
| Pima | 0.0 /100 | #331 | Tragic $50,539 |
| Dutch West Indians | 0.0 /100 | #332 | Tragic $50,475 |
| Cape Verdeans | 0.0 /100 | #333 | Tragic $50,077 |
| Immigrants | Dominica | 0.0 /100 | #334 | Tragic $50,071 |
| Crow | 0.0 /100 | #335 | Tragic $49,234 |
| Cubans | 0.0 /100 | #336 | Tragic $49,152 |
Demographics Similar to Somalis by Householder Income Over 65 years
In terms of householder income over 65 years, the demographic groups most similar to Somalis are Immigrants from Jamaica ($54,027, a difference of 0.040%), Immigrants from Ecuador ($54,030, a difference of 0.050%), Blackfeet ($54,029, a difference of 0.050%), Immigrants from Armenia ($53,974, a difference of 0.060%), and Immigrants from Liberia ($53,967, a difference of 0.070%).
| Demographics | Rating | Rank | Householder Income Over 65 years |
| Barbadians | 0.1 /100 | #274 | Tragic $54,163 |
| Cherokee | 0.1 /100 | #275 | Tragic $54,133 |
| Cree | 0.1 /100 | #276 | Tragic $54,129 |
| Cheyenne | 0.1 /100 | #277 | Tragic $54,096 |
| Immigrants | Ecuador | 0.1 /100 | #278 | Tragic $54,030 |
| Blackfeet | 0.1 /100 | #279 | Tragic $54,029 |
| Immigrants | Jamaica | 0.1 /100 | #280 | Tragic $54,027 |
| Somalis | 0.1 /100 | #281 | Tragic $54,004 |
| Immigrants | Armenia | 0.1 /100 | #282 | Tragic $53,974 |
| Immigrants | Liberia | 0.1 /100 | #283 | Tragic $53,967 |
| Immigrants | Guatemala | 0.1 /100 | #284 | Tragic $53,950 |
| Mexicans | 0.1 /100 | #285 | Tragic $53,897 |
| Chippewa | 0.1 /100 | #286 | Tragic $53,847 |
| Immigrants | Barbados | 0.1 /100 | #287 | Tragic $53,766 |
| Paiute | 0.1 /100 | #288 | Tragic $53,762 |