Black/African American vs Yakama Householder Income Over 65 years
COMPARE
Black/African American
Yakama
Householder Income Over 65 years
Householder Income Over 65 years Comparison
Blacks/African Americans
Yakama
$50,779
HOUSEHOLDER INCOME OVER 65 YEARS
0.0/ 100
METRIC RATING
329th/ 347
METRIC RANK
$56,234
HOUSEHOLDER INCOME OVER 65 YEARS
0.7/ 100
METRIC RATING
247th/ 347
METRIC RANK
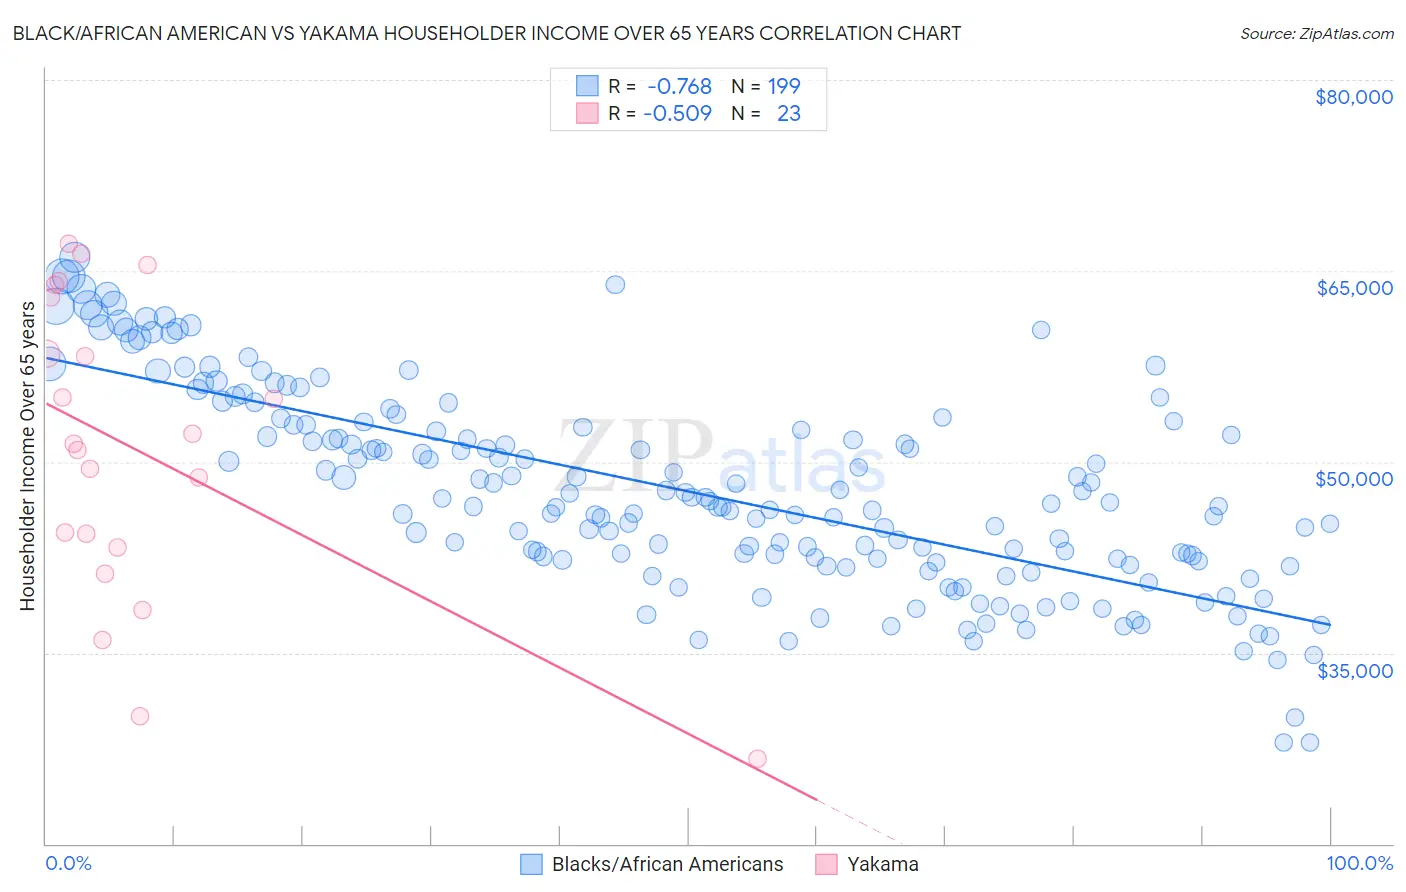
Black/African American vs Yakama Householder Income Over 65 years Correlation Chart
The statistical analysis conducted on geographies consisting of 560,756,533 people shows a strong negative correlation between the proportion of Blacks/African Americans and household income with householder over the age of 65 in the United States with a correlation coefficient (R) of -0.768 and weighted average of $50,779. Similarly, the statistical analysis conducted on geographies consisting of 19,889,958 people shows a substantial negative correlation between the proportion of Yakama and household income with householder over the age of 65 in the United States with a correlation coefficient (R) of -0.509 and weighted average of $56,234, a difference of 10.7%.
Householder Income Over 65 years Correlation Summary
| Measurement | Black/African American | Yakama |
| Minimum | $27,967 | $26,667 |
| Maximum | $66,084 | $67,099 |
| Range | $38,117 | $40,432 |
| Mean | $47,714 | $51,039 |
| Median | $46,741 | $51,401 |
| Interquartile 25% (IQ1) | $42,258 | $43,321 |
| Interquartile 75% (IQ3) | $52,943 | $62,905 |
| Interquartile Range (IQR) | $10,685 | $19,584 |
| Standard Deviation (Sample) | $7,891 | $11,672 |
| Standard Deviation (Population) | $7,872 | $11,415 |
Similar Demographics by Householder Income Over 65 years
Demographics Similar to Blacks/African Americans by Householder Income Over 65 years
In terms of householder income over 65 years, the demographic groups most similar to Blacks/African Americans are Immigrants from Grenada ($50,747, a difference of 0.060%), Hopi ($50,925, a difference of 0.29%), Bahamian ($51,000, a difference of 0.44%), Pima ($50,539, a difference of 0.47%), and Dutch West Indian ($50,475, a difference of 0.60%).
| Demographics | Rating | Rank | Householder Income Over 65 years |
| British West Indians | 0.0 /100 | #322 | Tragic $51,463 |
| Cajuns | 0.0 /100 | #323 | Tragic $51,397 |
| Immigrants | Congo | 0.0 /100 | #324 | Tragic $51,393 |
| Immigrants | Haiti | 0.0 /100 | #325 | Tragic $51,219 |
| Kiowa | 0.0 /100 | #326 | Tragic $51,140 |
| Bahamians | 0.0 /100 | #327 | Tragic $51,000 |
| Hopi | 0.0 /100 | #328 | Tragic $50,925 |
| Blacks/African Americans | 0.0 /100 | #329 | Tragic $50,779 |
| Immigrants | Grenada | 0.0 /100 | #330 | Tragic $50,747 |
| Pima | 0.0 /100 | #331 | Tragic $50,539 |
| Dutch West Indians | 0.0 /100 | #332 | Tragic $50,475 |
| Cape Verdeans | 0.0 /100 | #333 | Tragic $50,077 |
| Immigrants | Dominica | 0.0 /100 | #334 | Tragic $50,071 |
| Crow | 0.0 /100 | #335 | Tragic $49,234 |
| Cubans | 0.0 /100 | #336 | Tragic $49,152 |
Demographics Similar to Yakama by Householder Income Over 65 years
In terms of householder income over 65 years, the demographic groups most similar to Yakama are Central American ($56,321, a difference of 0.15%), Vietnamese ($56,143, a difference of 0.16%), Immigrants from Uzbekistan ($56,331, a difference of 0.17%), Hmong ($56,339, a difference of 0.19%), and Guyanese ($56,351, a difference of 0.21%).
| Demographics | Rating | Rank | Householder Income Over 65 years |
| Sub-Saharan Africans | 1.0 /100 | #240 | Tragic $56,615 |
| Immigrants | Guyana | 0.9 /100 | #241 | Tragic $56,495 |
| Yaqui | 0.8 /100 | #242 | Tragic $56,417 |
| Guyanese | 0.8 /100 | #243 | Tragic $56,351 |
| Hmong | 0.8 /100 | #244 | Tragic $56,339 |
| Immigrants | Uzbekistan | 0.8 /100 | #245 | Tragic $56,331 |
| Central Americans | 0.8 /100 | #246 | Tragic $56,321 |
| Yakama | 0.7 /100 | #247 | Tragic $56,234 |
| Vietnamese | 0.6 /100 | #248 | Tragic $56,143 |
| Mexican American Indians | 0.6 /100 | #249 | Tragic $56,089 |
| Immigrants | Bosnia and Herzegovina | 0.5 /100 | #250 | Tragic $55,986 |
| Immigrants | Portugal | 0.5 /100 | #251 | Tragic $55,924 |
| Osage | 0.4 /100 | #252 | Tragic $55,677 |
| Immigrants | Trinidad and Tobago | 0.4 /100 | #253 | Tragic $55,598 |
| Americans | 0.3 /100 | #254 | Tragic $55,527 |