Guyanese vs Ecuadorian Householder Income Over 65 years
COMPARE
Guyanese
Ecuadorian
Householder Income Over 65 years
Householder Income Over 65 years Comparison
Guyanese
Ecuadorians
$56,351
HOUSEHOLDER INCOME OVER 65 YEARS
0.8/ 100
METRIC RATING
243rd/ 347
METRIC RANK
$54,958
HOUSEHOLDER INCOME OVER 65 YEARS
0.2/ 100
METRIC RATING
258th/ 347
METRIC RANK
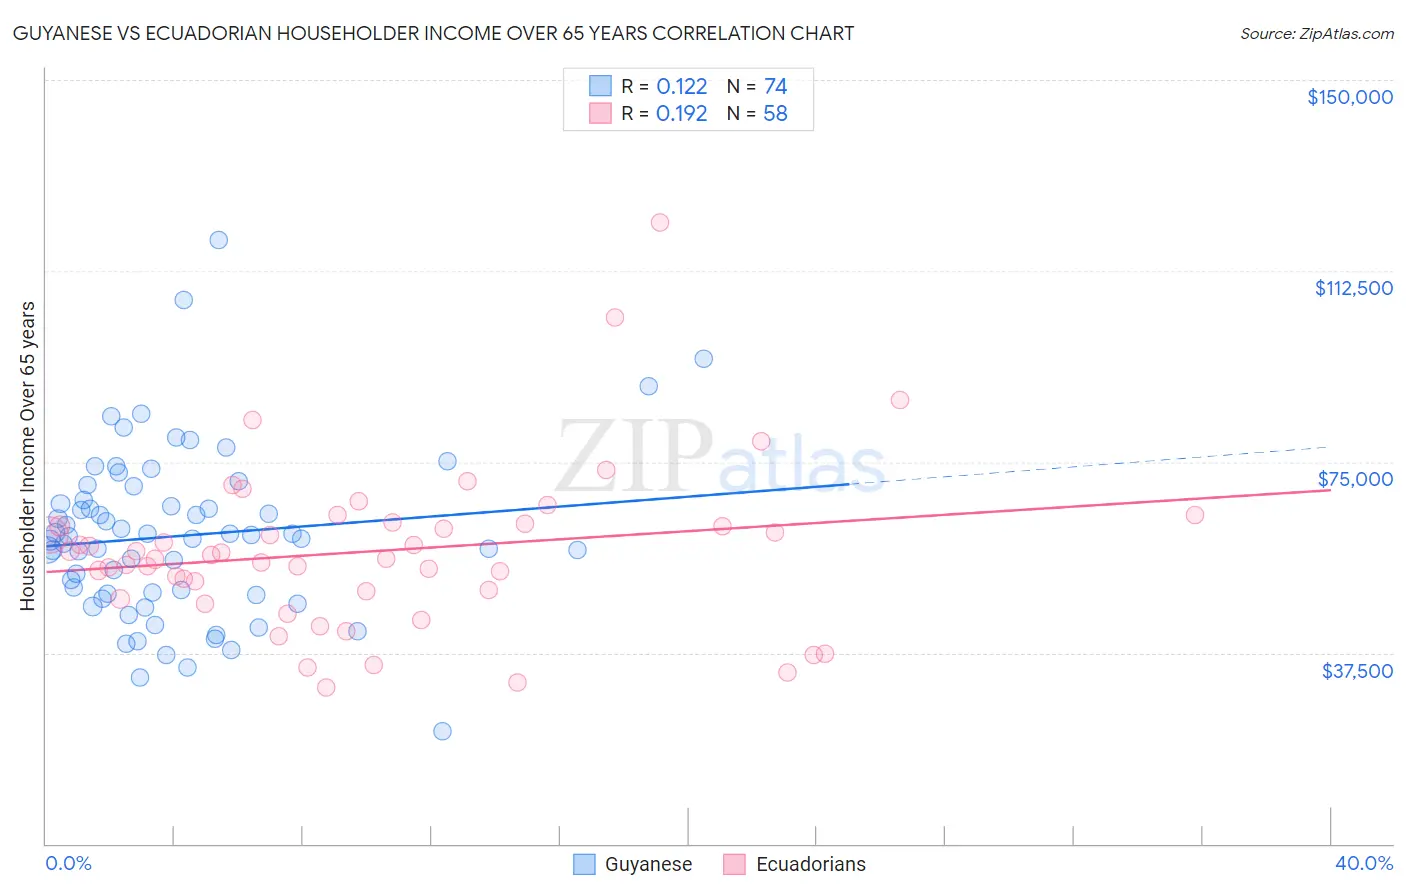
Guyanese vs Ecuadorian Householder Income Over 65 years Correlation Chart
The statistical analysis conducted on geographies consisting of 176,487,050 people shows a poor positive correlation between the proportion of Guyanese and household income with householder over the age of 65 in the United States with a correlation coefficient (R) of 0.122 and weighted average of $56,351. Similarly, the statistical analysis conducted on geographies consisting of 316,764,939 people shows a poor positive correlation between the proportion of Ecuadorians and household income with householder over the age of 65 in the United States with a correlation coefficient (R) of 0.192 and weighted average of $54,958, a difference of 2.5%.
Householder Income Over 65 years Correlation Summary
| Measurement | Guyanese | Ecuadorian |
| Minimum | $22,090 | $30,682 |
| Maximum | $118,508 | $121,912 |
| Range | $96,418 | $91,230 |
| Mean | $60,484 | $57,458 |
| Median | $60,185 | $56,254 |
| Interquartile 25% (IQ1) | $49,040 | $49,530 |
| Interquartile 75% (IQ3) | $67,479 | $62,875 |
| Interquartile Range (IQR) | $18,439 | $13,345 |
| Standard Deviation (Sample) | $16,619 | $16,134 |
| Standard Deviation (Population) | $16,506 | $15,994 |
Demographics Similar to Guyanese and Ecuadorians by Householder Income Over 65 years
In terms of householder income over 65 years, the demographic groups most similar to Guyanese are Hmong ($56,339, a difference of 0.020%), Immigrants from Uzbekistan ($56,331, a difference of 0.040%), Central American ($56,321, a difference of 0.050%), Yaqui ($56,417, a difference of 0.12%), and Yakama ($56,234, a difference of 0.21%). Similarly, the demographic groups most similar to Ecuadorians are West Indian ($54,936, a difference of 0.040%), Immigrants from West Indies ($54,927, a difference of 0.060%), Trinidadian and Tobagonian ($55,327, a difference of 0.67%), German Russian ($55,356, a difference of 0.72%), and Immigrants from Bangladesh ($55,394, a difference of 0.79%).
| Demographics | Rating | Rank | Householder Income Over 65 years |
| Sub-Saharan Africans | 1.0 /100 | #240 | Tragic $56,615 |
| Immigrants | Guyana | 0.9 /100 | #241 | Tragic $56,495 |
| Yaqui | 0.8 /100 | #242 | Tragic $56,417 |
| Guyanese | 0.8 /100 | #243 | Tragic $56,351 |
| Hmong | 0.8 /100 | #244 | Tragic $56,339 |
| Immigrants | Uzbekistan | 0.8 /100 | #245 | Tragic $56,331 |
| Central Americans | 0.8 /100 | #246 | Tragic $56,321 |
| Yakama | 0.7 /100 | #247 | Tragic $56,234 |
| Vietnamese | 0.6 /100 | #248 | Tragic $56,143 |
| Mexican American Indians | 0.6 /100 | #249 | Tragic $56,089 |
| Immigrants | Bosnia and Herzegovina | 0.5 /100 | #250 | Tragic $55,986 |
| Immigrants | Portugal | 0.5 /100 | #251 | Tragic $55,924 |
| Osage | 0.4 /100 | #252 | Tragic $55,677 |
| Immigrants | Trinidad and Tobago | 0.4 /100 | #253 | Tragic $55,598 |
| Americans | 0.3 /100 | #254 | Tragic $55,527 |
| Immigrants | Bangladesh | 0.3 /100 | #255 | Tragic $55,394 |
| German Russians | 0.3 /100 | #256 | Tragic $55,356 |
| Trinidadians and Tobagonians | 0.3 /100 | #257 | Tragic $55,327 |
| Ecuadorians | 0.2 /100 | #258 | Tragic $54,958 |
| West Indians | 0.2 /100 | #259 | Tragic $54,936 |
| Immigrants | West Indies | 0.2 /100 | #260 | Tragic $54,927 |