Eastern European vs Ecuadorian Householder Income Over 65 years
COMPARE
Eastern European
Ecuadorian
Householder Income Over 65 years
Householder Income Over 65 years Comparison
Eastern Europeans
Ecuadorians
$70,470
HOUSEHOLDER INCOME OVER 65 YEARS
100.0/ 100
METRIC RATING
18th/ 347
METRIC RANK
$54,958
HOUSEHOLDER INCOME OVER 65 YEARS
0.2/ 100
METRIC RATING
258th/ 347
METRIC RANK
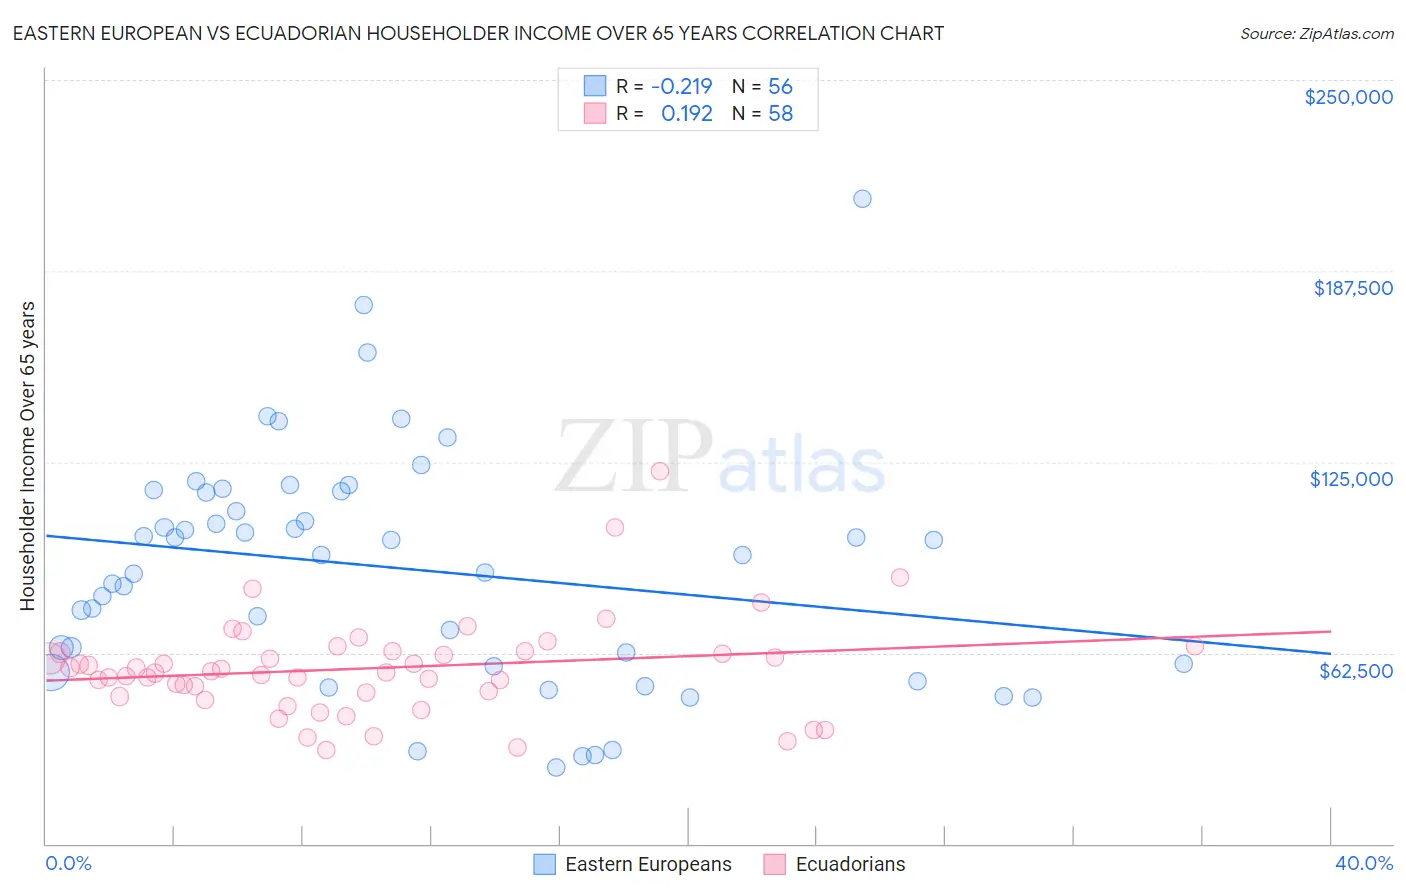
Eastern European vs Ecuadorian Householder Income Over 65 years Correlation Chart
The statistical analysis conducted on geographies consisting of 459,430,527 people shows a weak negative correlation between the proportion of Eastern Europeans and household income with householder over the age of 65 in the United States with a correlation coefficient (R) of -0.219 and weighted average of $70,470. Similarly, the statistical analysis conducted on geographies consisting of 316,764,939 people shows a poor positive correlation between the proportion of Ecuadorians and household income with householder over the age of 65 in the United States with a correlation coefficient (R) of 0.192 and weighted average of $54,958, a difference of 28.2%.
Householder Income Over 65 years Correlation Summary
| Measurement | Eastern European | Ecuadorian |
| Minimum | $24,862 | $30,682 |
| Maximum | $211,250 | $121,912 |
| Range | $186,388 | $91,230 |
| Mean | $90,025 | $57,458 |
| Median | $94,688 | $56,254 |
| Interquartile 25% (IQ1) | $58,403 | $49,530 |
| Interquartile 75% (IQ3) | $115,041 | $62,875 |
| Interquartile Range (IQR) | $56,638 | $13,345 |
| Standard Deviation (Sample) | $38,316 | $16,134 |
| Standard Deviation (Population) | $37,972 | $15,994 |
Similar Demographics by Householder Income Over 65 years
Demographics Similar to Eastern Europeans by Householder Income Over 65 years
In terms of householder income over 65 years, the demographic groups most similar to Eastern Europeans are Immigrants from Korea ($70,696, a difference of 0.32%), Indian (Asian) ($70,238, a difference of 0.33%), Immigrants from South Central Asia ($70,103, a difference of 0.52%), Okinawan ($70,846, a difference of 0.53%), and Native Hawaiian ($71,021, a difference of 0.78%).
| Demographics | Rating | Rank | Householder Income Over 65 years |
| Thais | 100.0 /100 | #11 | Exceptional $72,099 |
| Cypriots | 100.0 /100 | #12 | Exceptional $71,714 |
| Immigrants | Hong Kong | 100.0 /100 | #13 | Exceptional $71,567 |
| Burmese | 100.0 /100 | #14 | Exceptional $71,139 |
| Native Hawaiians | 100.0 /100 | #15 | Exceptional $71,021 |
| Okinawans | 100.0 /100 | #16 | Exceptional $70,846 |
| Immigrants | Korea | 100.0 /100 | #17 | Exceptional $70,696 |
| Eastern Europeans | 100.0 /100 | #18 | Exceptional $70,470 |
| Indians (Asian) | 100.0 /100 | #19 | Exceptional $70,238 |
| Immigrants | South Central Asia | 100.0 /100 | #20 | Exceptional $70,103 |
| Immigrants | Eastern Asia | 100.0 /100 | #21 | Exceptional $69,872 |
| Immigrants | Israel | 100.0 /100 | #22 | Exceptional $69,857 |
| Immigrants | Japan | 100.0 /100 | #23 | Exceptional $69,774 |
| Immigrants | Sweden | 100.0 /100 | #24 | Exceptional $69,722 |
| Immigrants | Belgium | 100.0 /100 | #25 | Exceptional $69,703 |
Demographics Similar to Ecuadorians by Householder Income Over 65 years
In terms of householder income over 65 years, the demographic groups most similar to Ecuadorians are West Indian ($54,936, a difference of 0.040%), Immigrants from West Indies ($54,927, a difference of 0.060%), Comanche ($54,922, a difference of 0.070%), Bangladeshi ($54,719, a difference of 0.44%), and French American Indian ($54,699, a difference of 0.47%).
| Demographics | Rating | Rank | Householder Income Over 65 years |
| Immigrants | Portugal | 0.5 /100 | #251 | Tragic $55,924 |
| Osage | 0.4 /100 | #252 | Tragic $55,677 |
| Immigrants | Trinidad and Tobago | 0.4 /100 | #253 | Tragic $55,598 |
| Americans | 0.3 /100 | #254 | Tragic $55,527 |
| Immigrants | Bangladesh | 0.3 /100 | #255 | Tragic $55,394 |
| German Russians | 0.3 /100 | #256 | Tragic $55,356 |
| Trinidadians and Tobagonians | 0.3 /100 | #257 | Tragic $55,327 |
| Ecuadorians | 0.2 /100 | #258 | Tragic $54,958 |
| West Indians | 0.2 /100 | #259 | Tragic $54,936 |
| Immigrants | West Indies | 0.2 /100 | #260 | Tragic $54,927 |
| Comanche | 0.2 /100 | #261 | Tragic $54,922 |
| Bangladeshis | 0.1 /100 | #262 | Tragic $54,719 |
| French American Indians | 0.1 /100 | #263 | Tragic $54,699 |
| Apache | 0.1 /100 | #264 | Tragic $54,668 |
| Belizeans | 0.1 /100 | #265 | Tragic $54,580 |