Black/African American vs Jamaican Householder Income Over 65 years
COMPARE
Black/African American
Jamaican
Householder Income Over 65 years
Householder Income Over 65 years Comparison
Blacks/African Americans
Jamaicans
$50,779
HOUSEHOLDER INCOME OVER 65 YEARS
0.0/ 100
METRIC RATING
329th/ 347
METRIC RANK
$54,560
HOUSEHOLDER INCOME OVER 65 YEARS
0.1/ 100
METRIC RATING
266th/ 347
METRIC RANK
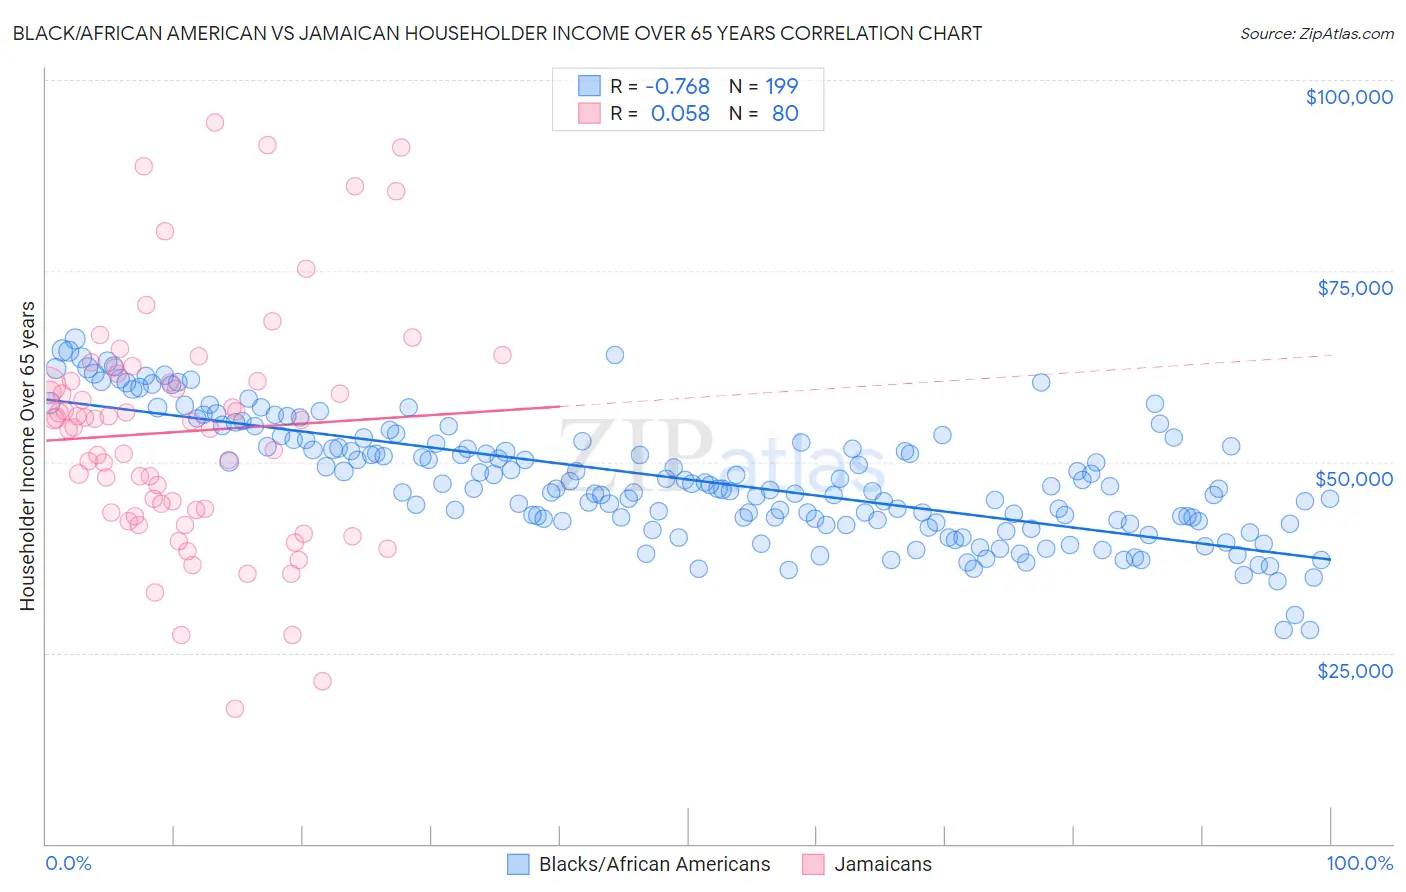
Black/African American vs Jamaican Householder Income Over 65 years Correlation Chart
The statistical analysis conducted on geographies consisting of 560,756,533 people shows a strong negative correlation between the proportion of Blacks/African Americans and household income with householder over the age of 65 in the United States with a correlation coefficient (R) of -0.768 and weighted average of $50,779. Similarly, the statistical analysis conducted on geographies consisting of 366,342,723 people shows a slight positive correlation between the proportion of Jamaicans and household income with householder over the age of 65 in the United States with a correlation coefficient (R) of 0.058 and weighted average of $54,560, a difference of 7.4%.
Householder Income Over 65 years Correlation Summary
| Measurement | Black/African American | Jamaican |
| Minimum | $27,967 | $17,596 |
| Maximum | $66,084 | $94,474 |
| Range | $38,117 | $76,878 |
| Mean | $47,714 | $53,994 |
| Median | $46,741 | $55,397 |
| Interquartile 25% (IQ1) | $42,258 | $43,595 |
| Interquartile 75% (IQ3) | $52,943 | $60,577 |
| Interquartile Range (IQR) | $10,685 | $16,982 |
| Standard Deviation (Sample) | $7,891 | $15,398 |
| Standard Deviation (Population) | $7,872 | $15,302 |
Similar Demographics by Householder Income Over 65 years
Demographics Similar to Blacks/African Americans by Householder Income Over 65 years
In terms of householder income over 65 years, the demographic groups most similar to Blacks/African Americans are Immigrants from Grenada ($50,747, a difference of 0.060%), Hopi ($50,925, a difference of 0.29%), Bahamian ($51,000, a difference of 0.44%), Pima ($50,539, a difference of 0.47%), and Dutch West Indian ($50,475, a difference of 0.60%).
| Demographics | Rating | Rank | Householder Income Over 65 years |
| British West Indians | 0.0 /100 | #322 | Tragic $51,463 |
| Cajuns | 0.0 /100 | #323 | Tragic $51,397 |
| Immigrants | Congo | 0.0 /100 | #324 | Tragic $51,393 |
| Immigrants | Haiti | 0.0 /100 | #325 | Tragic $51,219 |
| Kiowa | 0.0 /100 | #326 | Tragic $51,140 |
| Bahamians | 0.0 /100 | #327 | Tragic $51,000 |
| Hopi | 0.0 /100 | #328 | Tragic $50,925 |
| Blacks/African Americans | 0.0 /100 | #329 | Tragic $50,779 |
| Immigrants | Grenada | 0.0 /100 | #330 | Tragic $50,747 |
| Pima | 0.0 /100 | #331 | Tragic $50,539 |
| Dutch West Indians | 0.0 /100 | #332 | Tragic $50,475 |
| Cape Verdeans | 0.0 /100 | #333 | Tragic $50,077 |
| Immigrants | Dominica | 0.0 /100 | #334 | Tragic $50,071 |
| Crow | 0.0 /100 | #335 | Tragic $49,234 |
| Cubans | 0.0 /100 | #336 | Tragic $49,152 |
Demographics Similar to Jamaicans by Householder Income Over 65 years
In terms of householder income over 65 years, the demographic groups most similar to Jamaicans are Belizean ($54,580, a difference of 0.040%), Guatemalan ($54,526, a difference of 0.060%), Immigrants from Zaire ($54,512, a difference of 0.090%), Nicaraguan ($54,474, a difference of 0.16%), and Apache ($54,668, a difference of 0.20%).
| Demographics | Rating | Rank | Householder Income Over 65 years |
| West Indians | 0.2 /100 | #259 | Tragic $54,936 |
| Immigrants | West Indies | 0.2 /100 | #260 | Tragic $54,927 |
| Comanche | 0.2 /100 | #261 | Tragic $54,922 |
| Bangladeshis | 0.1 /100 | #262 | Tragic $54,719 |
| French American Indians | 0.1 /100 | #263 | Tragic $54,699 |
| Apache | 0.1 /100 | #264 | Tragic $54,668 |
| Belizeans | 0.1 /100 | #265 | Tragic $54,580 |
| Jamaicans | 0.1 /100 | #266 | Tragic $54,560 |
| Guatemalans | 0.1 /100 | #267 | Tragic $54,526 |
| Immigrants | Zaire | 0.1 /100 | #268 | Tragic $54,512 |
| Nicaraguans | 0.1 /100 | #269 | Tragic $54,474 |
| Immigrants | Senegal | 0.1 /100 | #270 | Tragic $54,447 |
| Liberians | 0.1 /100 | #271 | Tragic $54,356 |
| Potawatomi | 0.1 /100 | #272 | Tragic $54,212 |
| Indonesians | 0.1 /100 | #273 | Tragic $54,176 |