Black/African American vs Dutch West Indian Householder Income Over 65 years
COMPARE
Black/African American
Dutch West Indian
Householder Income Over 65 years
Householder Income Over 65 years Comparison
Blacks/African Americans
Dutch West Indians
$50,779
HOUSEHOLDER INCOME OVER 65 YEARS
0.0/ 100
METRIC RATING
329th/ 347
METRIC RANK
$50,475
HOUSEHOLDER INCOME OVER 65 YEARS
0.0/ 100
METRIC RATING
332nd/ 347
METRIC RANK
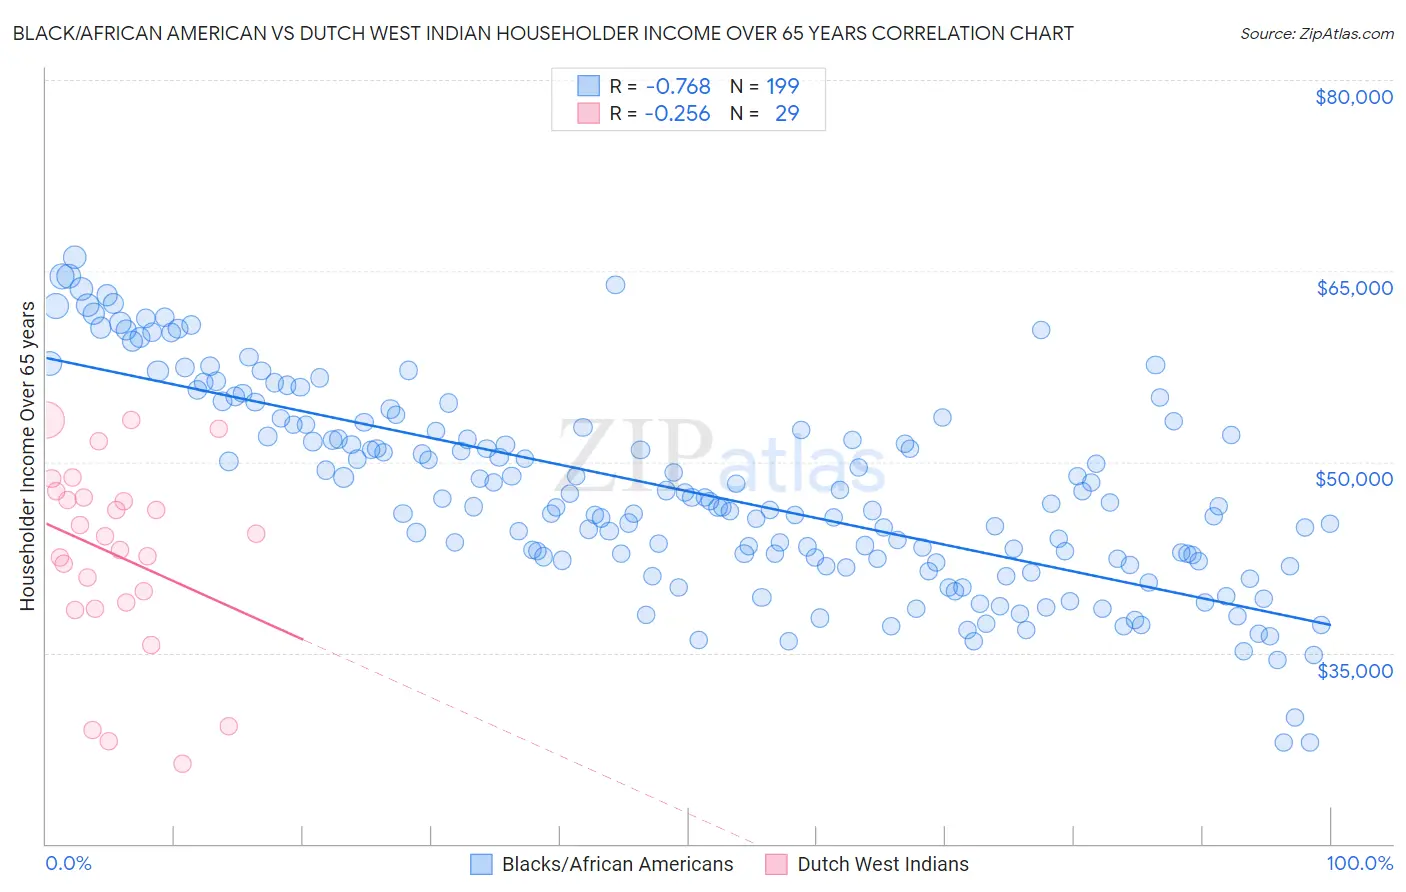
Black/African American vs Dutch West Indian Householder Income Over 65 years Correlation Chart
The statistical analysis conducted on geographies consisting of 560,756,533 people shows a strong negative correlation between the proportion of Blacks/African Americans and household income with householder over the age of 65 in the United States with a correlation coefficient (R) of -0.768 and weighted average of $50,779. Similarly, the statistical analysis conducted on geographies consisting of 85,634,723 people shows a weak negative correlation between the proportion of Dutch West Indians and household income with householder over the age of 65 in the United States with a correlation coefficient (R) of -0.256 and weighted average of $50,475, a difference of 0.60%.
Householder Income Over 65 years Correlation Summary
| Measurement | Black/African American | Dutch West Indian |
| Minimum | $27,967 | $26,250 |
| Maximum | $66,084 | $53,313 |
| Range | $38,117 | $27,063 |
| Mean | $47,714 | $42,695 |
| Median | $46,741 | $44,110 |
| Interquartile 25% (IQ1) | $42,258 | $38,754 |
| Interquartile 75% (IQ3) | $52,943 | $47,478 |
| Interquartile Range (IQR) | $10,685 | $8,725 |
| Standard Deviation (Sample) | $7,891 | $7,469 |
| Standard Deviation (Population) | $7,872 | $7,339 |
Demographics Similar to Blacks/African Americans and Dutch West Indians by Householder Income Over 65 years
In terms of householder income over 65 years, the demographic groups most similar to Blacks/African Americans are Immigrants from Grenada ($50,747, a difference of 0.060%), Hopi ($50,925, a difference of 0.29%), Bahamian ($51,000, a difference of 0.44%), Pima ($50,539, a difference of 0.47%), and Kiowa ($51,140, a difference of 0.71%). Similarly, the demographic groups most similar to Dutch West Indians are Pima ($50,539, a difference of 0.13%), Immigrants from Grenada ($50,747, a difference of 0.54%), Cape Verdean ($50,077, a difference of 0.79%), Immigrants from Dominica ($50,071, a difference of 0.81%), and Hopi ($50,925, a difference of 0.89%).
| Demographics | Rating | Rank | Householder Income Over 65 years |
| Colville | 0.0 /100 | #320 | Tragic $51,739 |
| Menominee | 0.0 /100 | #321 | Tragic $51,719 |
| British West Indians | 0.0 /100 | #322 | Tragic $51,463 |
| Cajuns | 0.0 /100 | #323 | Tragic $51,397 |
| Immigrants | Congo | 0.0 /100 | #324 | Tragic $51,393 |
| Immigrants | Haiti | 0.0 /100 | #325 | Tragic $51,219 |
| Kiowa | 0.0 /100 | #326 | Tragic $51,140 |
| Bahamians | 0.0 /100 | #327 | Tragic $51,000 |
| Hopi | 0.0 /100 | #328 | Tragic $50,925 |
| Blacks/African Americans | 0.0 /100 | #329 | Tragic $50,779 |
| Immigrants | Grenada | 0.0 /100 | #330 | Tragic $50,747 |
| Pima | 0.0 /100 | #331 | Tragic $50,539 |
| Dutch West Indians | 0.0 /100 | #332 | Tragic $50,475 |
| Cape Verdeans | 0.0 /100 | #333 | Tragic $50,077 |
| Immigrants | Dominica | 0.0 /100 | #334 | Tragic $50,071 |
| Crow | 0.0 /100 | #335 | Tragic $49,234 |
| Cubans | 0.0 /100 | #336 | Tragic $49,152 |
| Tohono O'odham | 0.0 /100 | #337 | Tragic $49,121 |
| Immigrants | Caribbean | 0.0 /100 | #338 | Tragic $48,535 |
| Navajo | 0.0 /100 | #339 | Tragic $47,722 |
| Immigrants | Yemen | 0.0 /100 | #340 | Tragic $47,527 |