Black/African American vs Spanish American Indian Householder Income Over 65 years
COMPARE
Black/African American
Spanish American Indian
Householder Income Over 65 years
Householder Income Over 65 years Comparison
Blacks/African Americans
Spanish American Indians
$50,779
HOUSEHOLDER INCOME OVER 65 YEARS
0.0/ 100
METRIC RATING
329th/ 347
METRIC RANK
$53,077
HOUSEHOLDER INCOME OVER 65 YEARS
0.0/ 100
METRIC RATING
302nd/ 347
METRIC RANK
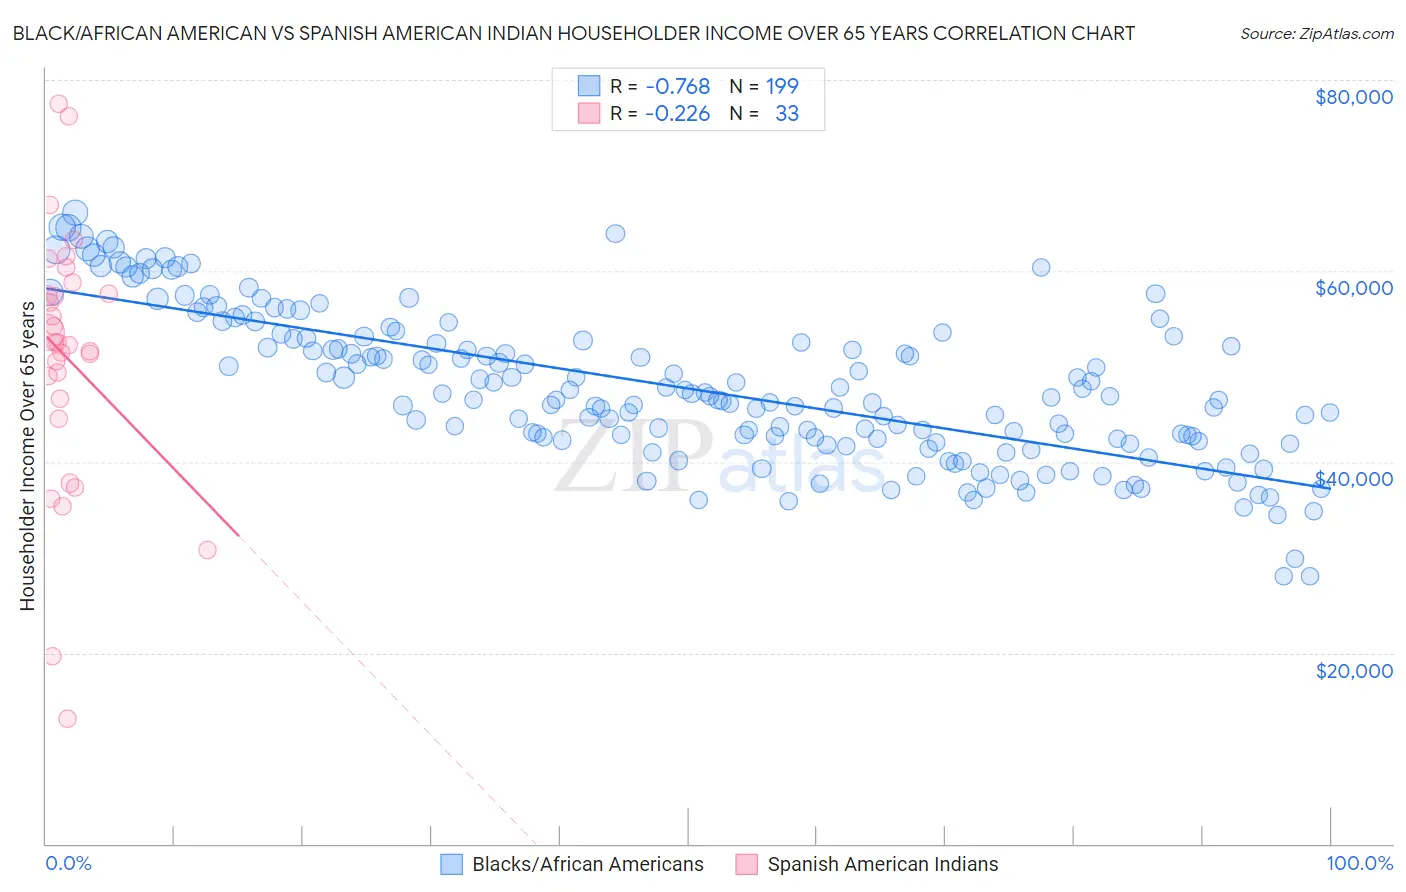
Black/African American vs Spanish American Indian Householder Income Over 65 years Correlation Chart
The statistical analysis conducted on geographies consisting of 560,756,533 people shows a strong negative correlation between the proportion of Blacks/African Americans and household income with householder over the age of 65 in the United States with a correlation coefficient (R) of -0.768 and weighted average of $50,779. Similarly, the statistical analysis conducted on geographies consisting of 73,128,660 people shows a weak negative correlation between the proportion of Spanish American Indians and household income with householder over the age of 65 in the United States with a correlation coefficient (R) of -0.226 and weighted average of $53,077, a difference of 4.5%.
Householder Income Over 65 years Correlation Summary
| Measurement | Black/African American | Spanish American Indian |
| Minimum | $27,967 | $13,050 |
| Maximum | $66,084 | $77,490 |
| Range | $38,117 | $64,440 |
| Mean | $47,714 | $50,895 |
| Median | $46,741 | $52,508 |
| Interquartile 25% (IQ1) | $42,258 | $45,560 |
| Interquartile 75% (IQ3) | $52,943 | $58,154 |
| Interquartile Range (IQR) | $10,685 | $12,594 |
| Standard Deviation (Sample) | $7,891 | $13,736 |
| Standard Deviation (Population) | $7,872 | $13,526 |
Similar Demographics by Householder Income Over 65 years
Demographics Similar to Blacks/African Americans by Householder Income Over 65 years
In terms of householder income over 65 years, the demographic groups most similar to Blacks/African Americans are Immigrants from Grenada ($50,747, a difference of 0.060%), Hopi ($50,925, a difference of 0.29%), Bahamian ($51,000, a difference of 0.44%), Pima ($50,539, a difference of 0.47%), and Dutch West Indian ($50,475, a difference of 0.60%).
| Demographics | Rating | Rank | Householder Income Over 65 years |
| British West Indians | 0.0 /100 | #322 | Tragic $51,463 |
| Cajuns | 0.0 /100 | #323 | Tragic $51,397 |
| Immigrants | Congo | 0.0 /100 | #324 | Tragic $51,393 |
| Immigrants | Haiti | 0.0 /100 | #325 | Tragic $51,219 |
| Kiowa | 0.0 /100 | #326 | Tragic $51,140 |
| Bahamians | 0.0 /100 | #327 | Tragic $51,000 |
| Hopi | 0.0 /100 | #328 | Tragic $50,925 |
| Blacks/African Americans | 0.0 /100 | #329 | Tragic $50,779 |
| Immigrants | Grenada | 0.0 /100 | #330 | Tragic $50,747 |
| Pima | 0.0 /100 | #331 | Tragic $50,539 |
| Dutch West Indians | 0.0 /100 | #332 | Tragic $50,475 |
| Cape Verdeans | 0.0 /100 | #333 | Tragic $50,077 |
| Immigrants | Dominica | 0.0 /100 | #334 | Tragic $50,071 |
| Crow | 0.0 /100 | #335 | Tragic $49,234 |
| Cubans | 0.0 /100 | #336 | Tragic $49,152 |
Demographics Similar to Spanish American Indians by Householder Income Over 65 years
In terms of householder income over 65 years, the demographic groups most similar to Spanish American Indians are Choctaw ($53,060, a difference of 0.030%), Yuman ($53,110, a difference of 0.060%), Immigrants from Bahamas ($53,174, a difference of 0.18%), Ute ($52,949, a difference of 0.24%), and Ottawa ($53,217, a difference of 0.27%).
| Demographics | Rating | Rank | Householder Income Over 65 years |
| Immigrants | Central America | 0.0 /100 | #295 | Tragic $53,420 |
| Immigrants | Somalia | 0.0 /100 | #296 | Tragic $53,333 |
| Immigrants | Latin America | 0.0 /100 | #297 | Tragic $53,265 |
| Central American Indians | 0.0 /100 | #298 | Tragic $53,232 |
| Ottawa | 0.0 /100 | #299 | Tragic $53,217 |
| Immigrants | Bahamas | 0.0 /100 | #300 | Tragic $53,174 |
| Yuman | 0.0 /100 | #301 | Tragic $53,110 |
| Spanish American Indians | 0.0 /100 | #302 | Tragic $53,077 |
| Choctaw | 0.0 /100 | #303 | Tragic $53,060 |
| Ute | 0.0 /100 | #304 | Tragic $52,949 |
| Pueblo | 0.0 /100 | #305 | Tragic $52,930 |
| Pennsylvania Germans | 0.0 /100 | #306 | Tragic $52,888 |
| Hispanics or Latinos | 0.0 /100 | #307 | Tragic $52,832 |
| Immigrants | Mexico | 0.0 /100 | #308 | Tragic $52,801 |
| Hondurans | 0.0 /100 | #309 | Tragic $52,634 |