Black/African American vs Okinawan Householder Income Over 65 years
COMPARE
Black/African American
Okinawan
Householder Income Over 65 years
Householder Income Over 65 years Comparison
Blacks/African Americans
Okinawans
$50,779
HOUSEHOLDER INCOME OVER 65 YEARS
0.0/ 100
METRIC RATING
329th/ 347
METRIC RANK
$70,846
HOUSEHOLDER INCOME OVER 65 YEARS
100.0/ 100
METRIC RATING
16th/ 347
METRIC RANK
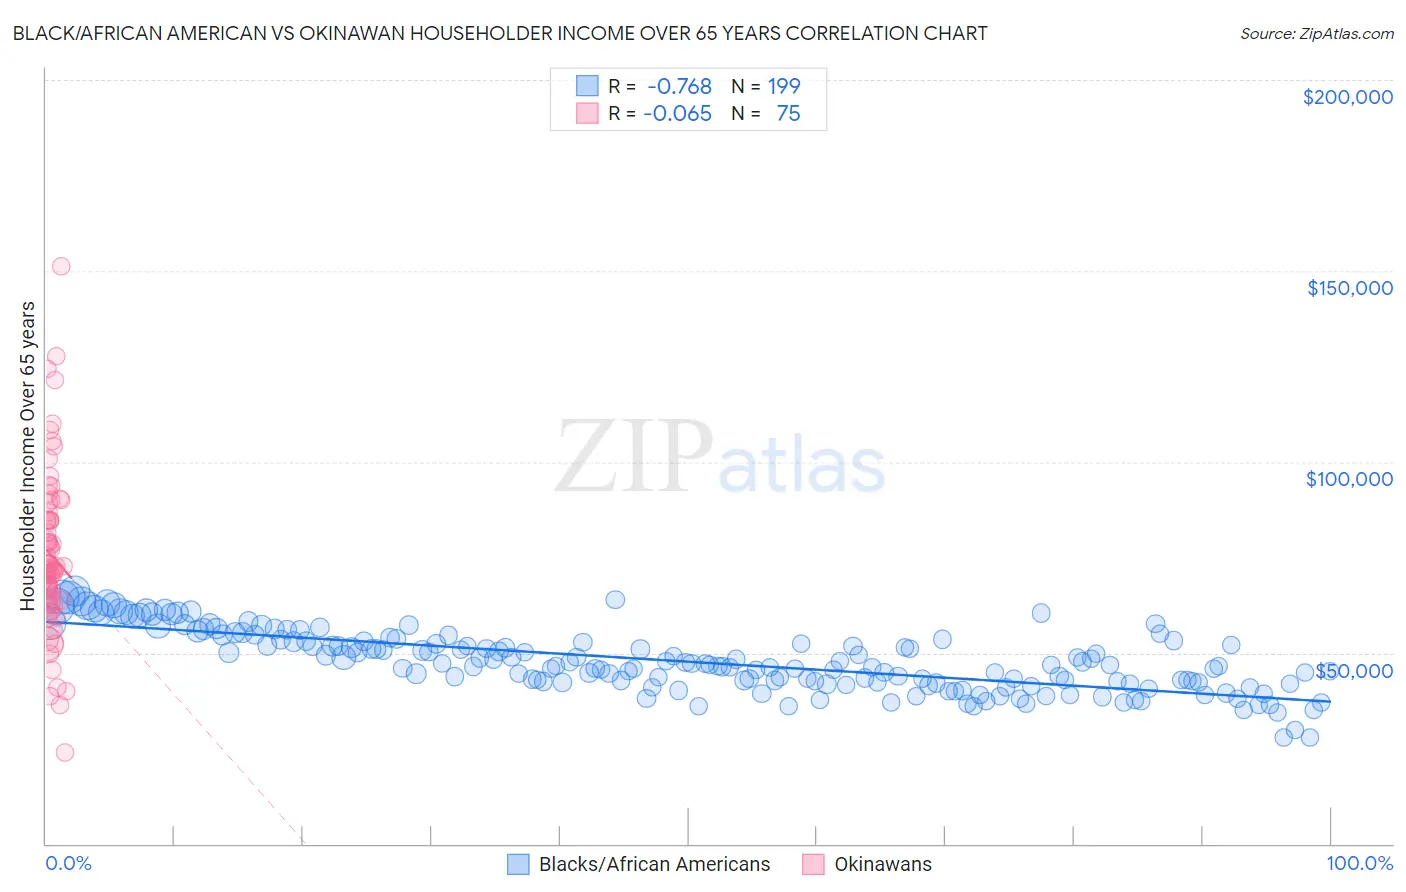
Black/African American vs Okinawan Householder Income Over 65 years Correlation Chart
The statistical analysis conducted on geographies consisting of 560,756,533 people shows a strong negative correlation between the proportion of Blacks/African Americans and household income with householder over the age of 65 in the United States with a correlation coefficient (R) of -0.768 and weighted average of $50,779. Similarly, the statistical analysis conducted on geographies consisting of 73,674,458 people shows a slight negative correlation between the proportion of Okinawans and household income with householder over the age of 65 in the United States with a correlation coefficient (R) of -0.065 and weighted average of $70,846, a difference of 39.5%.
Householder Income Over 65 years Correlation Summary
| Measurement | Black/African American | Okinawan |
| Minimum | $27,967 | $24,013 |
| Maximum | $66,084 | $151,316 |
| Range | $38,117 | $127,303 |
| Mean | $47,714 | $75,534 |
| Median | $46,741 | $72,378 |
| Interquartile 25% (IQ1) | $42,258 | $63,808 |
| Interquartile 75% (IQ3) | $52,943 | $84,880 |
| Interquartile Range (IQR) | $10,685 | $21,072 |
| Standard Deviation (Sample) | $7,891 | $21,585 |
| Standard Deviation (Population) | $7,872 | $21,441 |
Similar Demographics by Householder Income Over 65 years
Demographics Similar to Blacks/African Americans by Householder Income Over 65 years
In terms of householder income over 65 years, the demographic groups most similar to Blacks/African Americans are Immigrants from Grenada ($50,747, a difference of 0.060%), Hopi ($50,925, a difference of 0.29%), Bahamian ($51,000, a difference of 0.44%), Pima ($50,539, a difference of 0.47%), and Dutch West Indian ($50,475, a difference of 0.60%).
| Demographics | Rating | Rank | Householder Income Over 65 years |
| British West Indians | 0.0 /100 | #322 | Tragic $51,463 |
| Cajuns | 0.0 /100 | #323 | Tragic $51,397 |
| Immigrants | Congo | 0.0 /100 | #324 | Tragic $51,393 |
| Immigrants | Haiti | 0.0 /100 | #325 | Tragic $51,219 |
| Kiowa | 0.0 /100 | #326 | Tragic $51,140 |
| Bahamians | 0.0 /100 | #327 | Tragic $51,000 |
| Hopi | 0.0 /100 | #328 | Tragic $50,925 |
| Blacks/African Americans | 0.0 /100 | #329 | Tragic $50,779 |
| Immigrants | Grenada | 0.0 /100 | #330 | Tragic $50,747 |
| Pima | 0.0 /100 | #331 | Tragic $50,539 |
| Dutch West Indians | 0.0 /100 | #332 | Tragic $50,475 |
| Cape Verdeans | 0.0 /100 | #333 | Tragic $50,077 |
| Immigrants | Dominica | 0.0 /100 | #334 | Tragic $50,071 |
| Crow | 0.0 /100 | #335 | Tragic $49,234 |
| Cubans | 0.0 /100 | #336 | Tragic $49,152 |
Demographics Similar to Okinawans by Householder Income Over 65 years
In terms of householder income over 65 years, the demographic groups most similar to Okinawans are Immigrants from Korea ($70,696, a difference of 0.21%), Native Hawaiian ($71,021, a difference of 0.25%), Burmese ($71,139, a difference of 0.41%), Eastern European ($70,470, a difference of 0.53%), and Indian (Asian) ($70,238, a difference of 0.87%).
| Demographics | Rating | Rank | Householder Income Over 65 years |
| Immigrants | India | 100.0 /100 | #9 | Exceptional $72,804 |
| Bhutanese | 100.0 /100 | #10 | Exceptional $72,288 |
| Thais | 100.0 /100 | #11 | Exceptional $72,099 |
| Cypriots | 100.0 /100 | #12 | Exceptional $71,714 |
| Immigrants | Hong Kong | 100.0 /100 | #13 | Exceptional $71,567 |
| Burmese | 100.0 /100 | #14 | Exceptional $71,139 |
| Native Hawaiians | 100.0 /100 | #15 | Exceptional $71,021 |
| Okinawans | 100.0 /100 | #16 | Exceptional $70,846 |
| Immigrants | Korea | 100.0 /100 | #17 | Exceptional $70,696 |
| Eastern Europeans | 100.0 /100 | #18 | Exceptional $70,470 |
| Indians (Asian) | 100.0 /100 | #19 | Exceptional $70,238 |
| Immigrants | South Central Asia | 100.0 /100 | #20 | Exceptional $70,103 |
| Immigrants | Eastern Asia | 100.0 /100 | #21 | Exceptional $69,872 |
| Immigrants | Israel | 100.0 /100 | #22 | Exceptional $69,857 |
| Immigrants | Japan | 100.0 /100 | #23 | Exceptional $69,774 |