Black/African American vs Ugandan Householder Income Over 65 years
COMPARE
Black/African American
Ugandan
Householder Income Over 65 years
Householder Income Over 65 years Comparison
Blacks/African Americans
Ugandans
$50,779
HOUSEHOLDER INCOME OVER 65 YEARS
0.0/ 100
METRIC RATING
329th/ 347
METRIC RANK
$61,177
HOUSEHOLDER INCOME OVER 65 YEARS
55.5/ 100
METRIC RATING
163rd/ 347
METRIC RANK
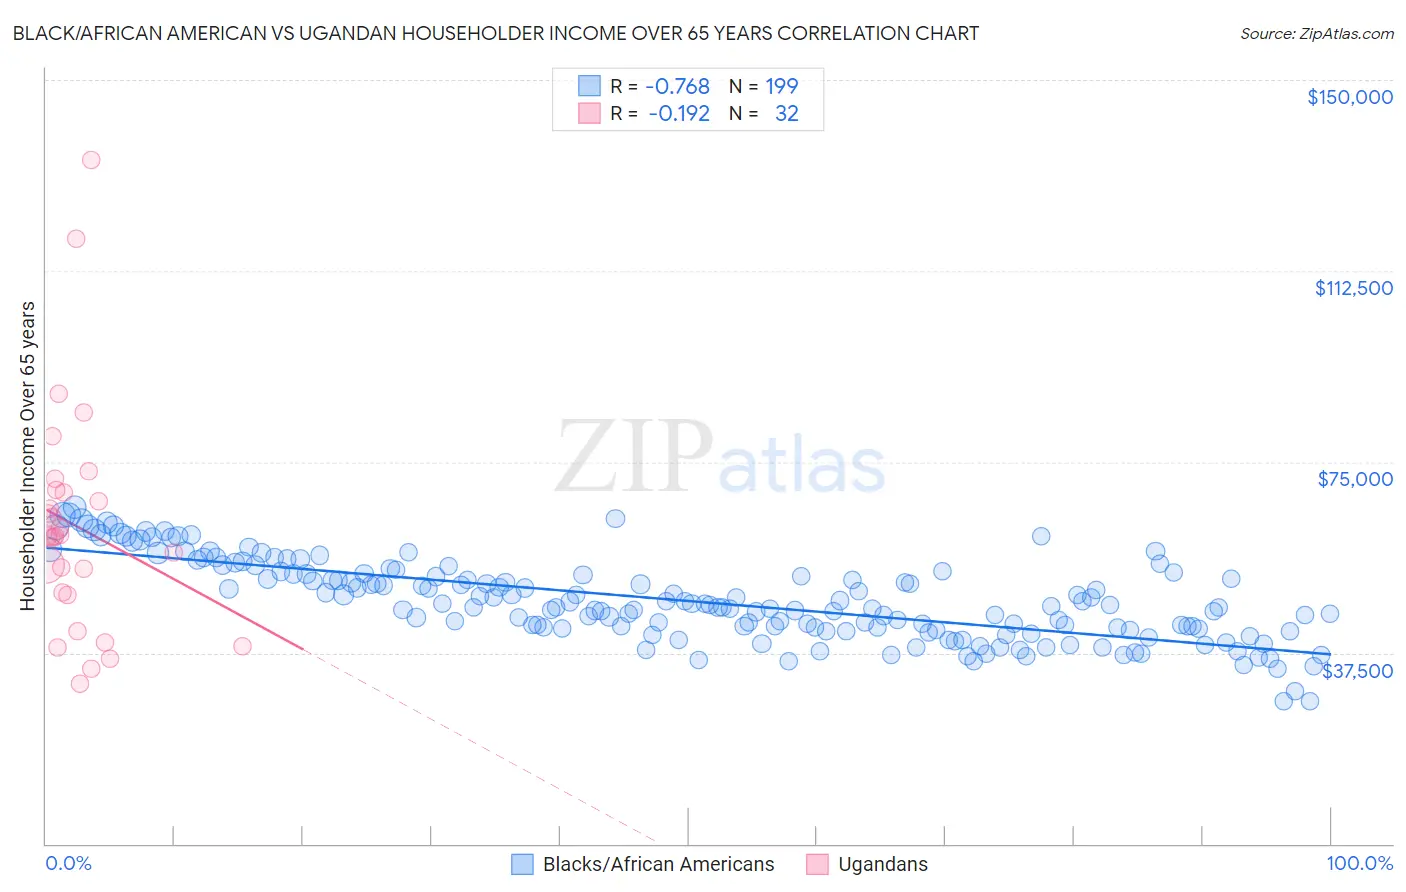
Black/African American vs Ugandan Householder Income Over 65 years Correlation Chart
The statistical analysis conducted on geographies consisting of 560,756,533 people shows a strong negative correlation between the proportion of Blacks/African Americans and household income with householder over the age of 65 in the United States with a correlation coefficient (R) of -0.768 and weighted average of $50,779. Similarly, the statistical analysis conducted on geographies consisting of 93,951,577 people shows a poor negative correlation between the proportion of Ugandans and household income with householder over the age of 65 in the United States with a correlation coefficient (R) of -0.192 and weighted average of $61,177, a difference of 20.5%.
Householder Income Over 65 years Correlation Summary
| Measurement | Black/African American | Ugandan |
| Minimum | $27,967 | $31,513 |
| Maximum | $66,084 | $134,340 |
| Range | $38,117 | $102,827 |
| Mean | $47,714 | $62,320 |
| Median | $46,741 | $60,326 |
| Interquartile 25% (IQ1) | $42,258 | $49,062 |
| Interquartile 75% (IQ3) | $52,943 | $69,172 |
| Interquartile Range (IQR) | $10,685 | $20,109 |
| Standard Deviation (Sample) | $7,891 | $22,191 |
| Standard Deviation (Population) | $7,872 | $21,841 |
Similar Demographics by Householder Income Over 65 years
Demographics Similar to Blacks/African Americans by Householder Income Over 65 years
In terms of householder income over 65 years, the demographic groups most similar to Blacks/African Americans are Immigrants from Grenada ($50,747, a difference of 0.060%), Hopi ($50,925, a difference of 0.29%), Bahamian ($51,000, a difference of 0.44%), Pima ($50,539, a difference of 0.47%), and Dutch West Indian ($50,475, a difference of 0.60%).
| Demographics | Rating | Rank | Householder Income Over 65 years |
| British West Indians | 0.0 /100 | #322 | Tragic $51,463 |
| Cajuns | 0.0 /100 | #323 | Tragic $51,397 |
| Immigrants | Congo | 0.0 /100 | #324 | Tragic $51,393 |
| Immigrants | Haiti | 0.0 /100 | #325 | Tragic $51,219 |
| Kiowa | 0.0 /100 | #326 | Tragic $51,140 |
| Bahamians | 0.0 /100 | #327 | Tragic $51,000 |
| Hopi | 0.0 /100 | #328 | Tragic $50,925 |
| Blacks/African Americans | 0.0 /100 | #329 | Tragic $50,779 |
| Immigrants | Grenada | 0.0 /100 | #330 | Tragic $50,747 |
| Pima | 0.0 /100 | #331 | Tragic $50,539 |
| Dutch West Indians | 0.0 /100 | #332 | Tragic $50,475 |
| Cape Verdeans | 0.0 /100 | #333 | Tragic $50,077 |
| Immigrants | Dominica | 0.0 /100 | #334 | Tragic $50,071 |
| Crow | 0.0 /100 | #335 | Tragic $49,234 |
| Cubans | 0.0 /100 | #336 | Tragic $49,152 |
Demographics Similar to Ugandans by Householder Income Over 65 years
In terms of householder income over 65 years, the demographic groups most similar to Ugandans are Immigrants from North Macedonia ($61,175, a difference of 0.0%), Immigrants from Ukraine ($61,163, a difference of 0.020%), Immigrants from Eastern Africa ($61,157, a difference of 0.030%), Czech ($61,244, a difference of 0.11%), and Norwegian ($61,104, a difference of 0.12%).
| Demographics | Rating | Rank | Householder Income Over 65 years |
| Scandinavians | 65.6 /100 | #156 | Good $61,586 |
| Macedonians | 65.1 /100 | #157 | Good $61,564 |
| English | 63.3 /100 | #158 | Good $61,487 |
| Brazilians | 62.7 /100 | #159 | Good $61,465 |
| Portuguese | 62.1 /100 | #160 | Good $61,440 |
| Icelanders | 57.9 /100 | #161 | Average $61,270 |
| Czechs | 57.2 /100 | #162 | Average $61,244 |
| Ugandans | 55.5 /100 | #163 | Average $61,177 |
| Immigrants | North Macedonia | 55.4 /100 | #164 | Average $61,175 |
| Immigrants | Ukraine | 55.1 /100 | #165 | Average $61,163 |
| Immigrants | Eastern Africa | 55.0 /100 | #166 | Average $61,157 |
| Norwegians | 53.6 /100 | #167 | Average $61,104 |
| Irish | 53.4 /100 | #168 | Average $61,097 |
| Carpatho Rusyns | 53.3 /100 | #169 | Average $61,093 |
| Serbians | 53.1 /100 | #170 | Average $61,087 |