Black/African American vs Zimbabwean Householder Income Over 65 years
COMPARE
Black/African American
Zimbabwean
Householder Income Over 65 years
Householder Income Over 65 years Comparison
Blacks/African Americans
Zimbabweans
$50,779
HOUSEHOLDER INCOME OVER 65 YEARS
0.0/ 100
METRIC RATING
329th/ 347
METRIC RANK
$65,854
HOUSEHOLDER INCOME OVER 65 YEARS
99.4/ 100
METRIC RATING
64th/ 347
METRIC RANK
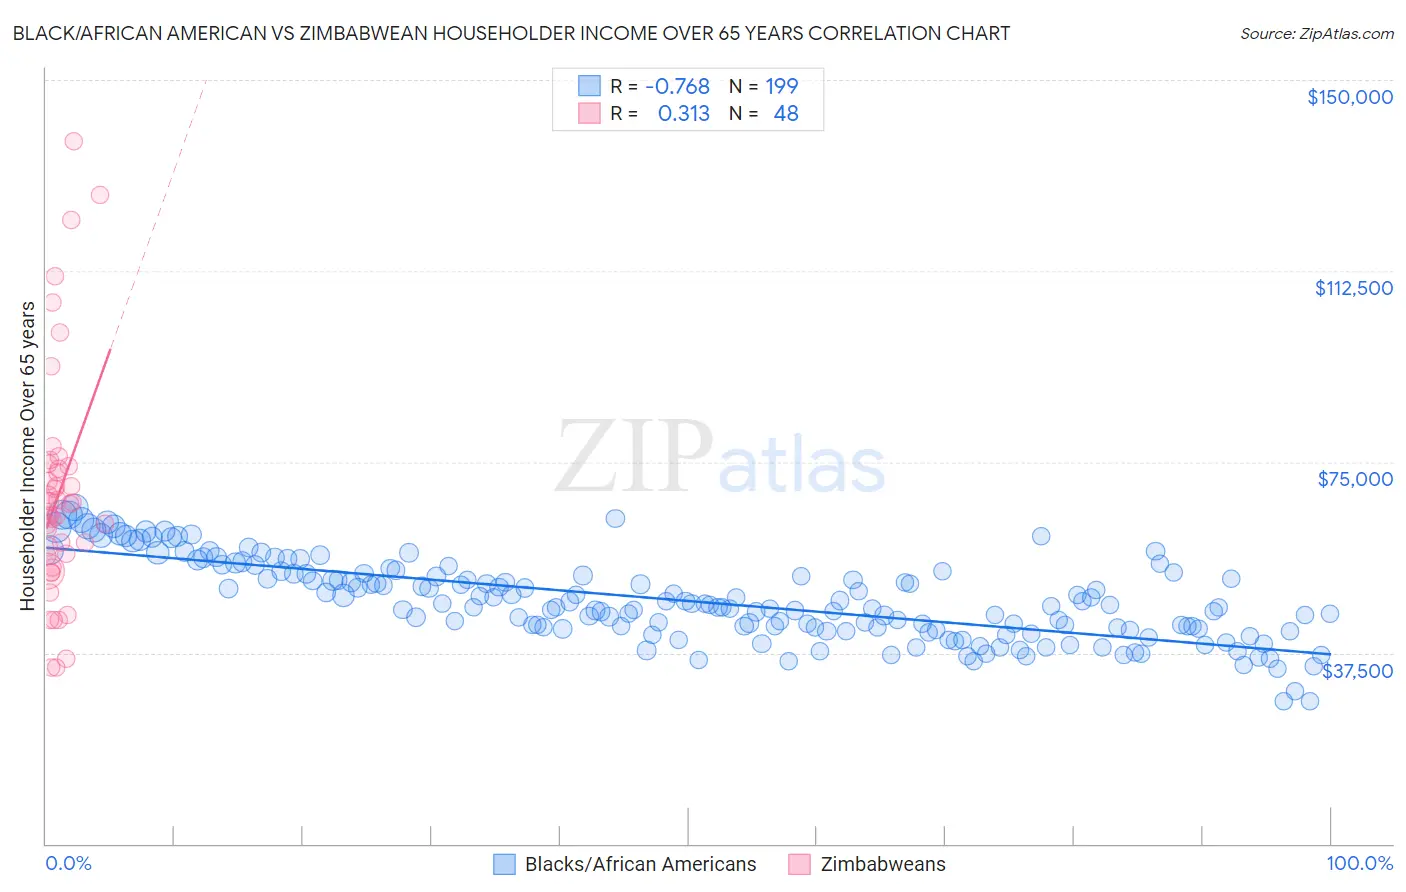
Black/African American vs Zimbabwean Householder Income Over 65 years Correlation Chart
The statistical analysis conducted on geographies consisting of 560,756,533 people shows a strong negative correlation between the proportion of Blacks/African Americans and household income with householder over the age of 65 in the United States with a correlation coefficient (R) of -0.768 and weighted average of $50,779. Similarly, the statistical analysis conducted on geographies consisting of 69,104,577 people shows a mild positive correlation between the proportion of Zimbabweans and household income with householder over the age of 65 in the United States with a correlation coefficient (R) of 0.313 and weighted average of $65,854, a difference of 29.7%.
Householder Income Over 65 years Correlation Summary
| Measurement | Black/African American | Zimbabwean |
| Minimum | $27,967 | $34,500 |
| Maximum | $66,084 | $137,885 |
| Range | $38,117 | $103,385 |
| Mean | $47,714 | $68,543 |
| Median | $46,741 | $65,700 |
| Interquartile 25% (IQ1) | $42,258 | $55,350 |
| Interquartile 75% (IQ3) | $52,943 | $73,919 |
| Interquartile Range (IQR) | $10,685 | $18,569 |
| Standard Deviation (Sample) | $7,891 | $22,680 |
| Standard Deviation (Population) | $7,872 | $22,443 |
Similar Demographics by Householder Income Over 65 years
Demographics Similar to Blacks/African Americans by Householder Income Over 65 years
In terms of householder income over 65 years, the demographic groups most similar to Blacks/African Americans are Immigrants from Grenada ($50,747, a difference of 0.060%), Hopi ($50,925, a difference of 0.29%), Bahamian ($51,000, a difference of 0.44%), Pima ($50,539, a difference of 0.47%), and Dutch West Indian ($50,475, a difference of 0.60%).
| Demographics | Rating | Rank | Householder Income Over 65 years |
| British West Indians | 0.0 /100 | #322 | Tragic $51,463 |
| Cajuns | 0.0 /100 | #323 | Tragic $51,397 |
| Immigrants | Congo | 0.0 /100 | #324 | Tragic $51,393 |
| Immigrants | Haiti | 0.0 /100 | #325 | Tragic $51,219 |
| Kiowa | 0.0 /100 | #326 | Tragic $51,140 |
| Bahamians | 0.0 /100 | #327 | Tragic $51,000 |
| Hopi | 0.0 /100 | #328 | Tragic $50,925 |
| Blacks/African Americans | 0.0 /100 | #329 | Tragic $50,779 |
| Immigrants | Grenada | 0.0 /100 | #330 | Tragic $50,747 |
| Pima | 0.0 /100 | #331 | Tragic $50,539 |
| Dutch West Indians | 0.0 /100 | #332 | Tragic $50,475 |
| Cape Verdeans | 0.0 /100 | #333 | Tragic $50,077 |
| Immigrants | Dominica | 0.0 /100 | #334 | Tragic $50,071 |
| Crow | 0.0 /100 | #335 | Tragic $49,234 |
| Cubans | 0.0 /100 | #336 | Tragic $49,152 |
Demographics Similar to Zimbabweans by Householder Income Over 65 years
In terms of householder income over 65 years, the demographic groups most similar to Zimbabweans are Marshallese ($65,874, a difference of 0.030%), Immigrants from England ($65,715, a difference of 0.21%), Immigrants from Sierra Leone ($66,009, a difference of 0.23%), Maltese ($66,027, a difference of 0.26%), and South African ($65,652, a difference of 0.31%).
| Demographics | Rating | Rank | Householder Income Over 65 years |
| Bulgarians | 99.6 /100 | #57 | Exceptional $66,236 |
| Immigrants | Philippines | 99.6 /100 | #58 | Exceptional $66,161 |
| Immigrants | Norway | 99.5 /100 | #59 | Exceptional $66,118 |
| Immigrants | Lithuania | 99.5 /100 | #60 | Exceptional $66,087 |
| Maltese | 99.5 /100 | #61 | Exceptional $66,027 |
| Immigrants | Sierra Leone | 99.5 /100 | #62 | Exceptional $66,009 |
| Marshallese | 99.4 /100 | #63 | Exceptional $65,874 |
| Zimbabweans | 99.4 /100 | #64 | Exceptional $65,854 |
| Immigrants | England | 99.3 /100 | #65 | Exceptional $65,715 |
| South Africans | 99.3 /100 | #66 | Exceptional $65,652 |
| Immigrants | Malaysia | 99.1 /100 | #67 | Exceptional $65,497 |
| Egyptians | 99.1 /100 | #68 | Exceptional $65,441 |
| Samoans | 99.1 /100 | #69 | Exceptional $65,427 |
| Mongolians | 99.0 /100 | #70 | Exceptional $65,326 |
| Greeks | 98.9 /100 | #71 | Exceptional $65,306 |