Black/African American vs Carpatho Rusyn Householder Income Over 65 years
COMPARE
Black/African American
Carpatho Rusyn
Householder Income Over 65 years
Householder Income Over 65 years Comparison
Blacks/African Americans
Carpatho Rusyns
$50,779
HOUSEHOLDER INCOME OVER 65 YEARS
0.0/ 100
METRIC RATING
329th/ 347
METRIC RANK
$61,093
HOUSEHOLDER INCOME OVER 65 YEARS
53.3/ 100
METRIC RATING
169th/ 347
METRIC RANK
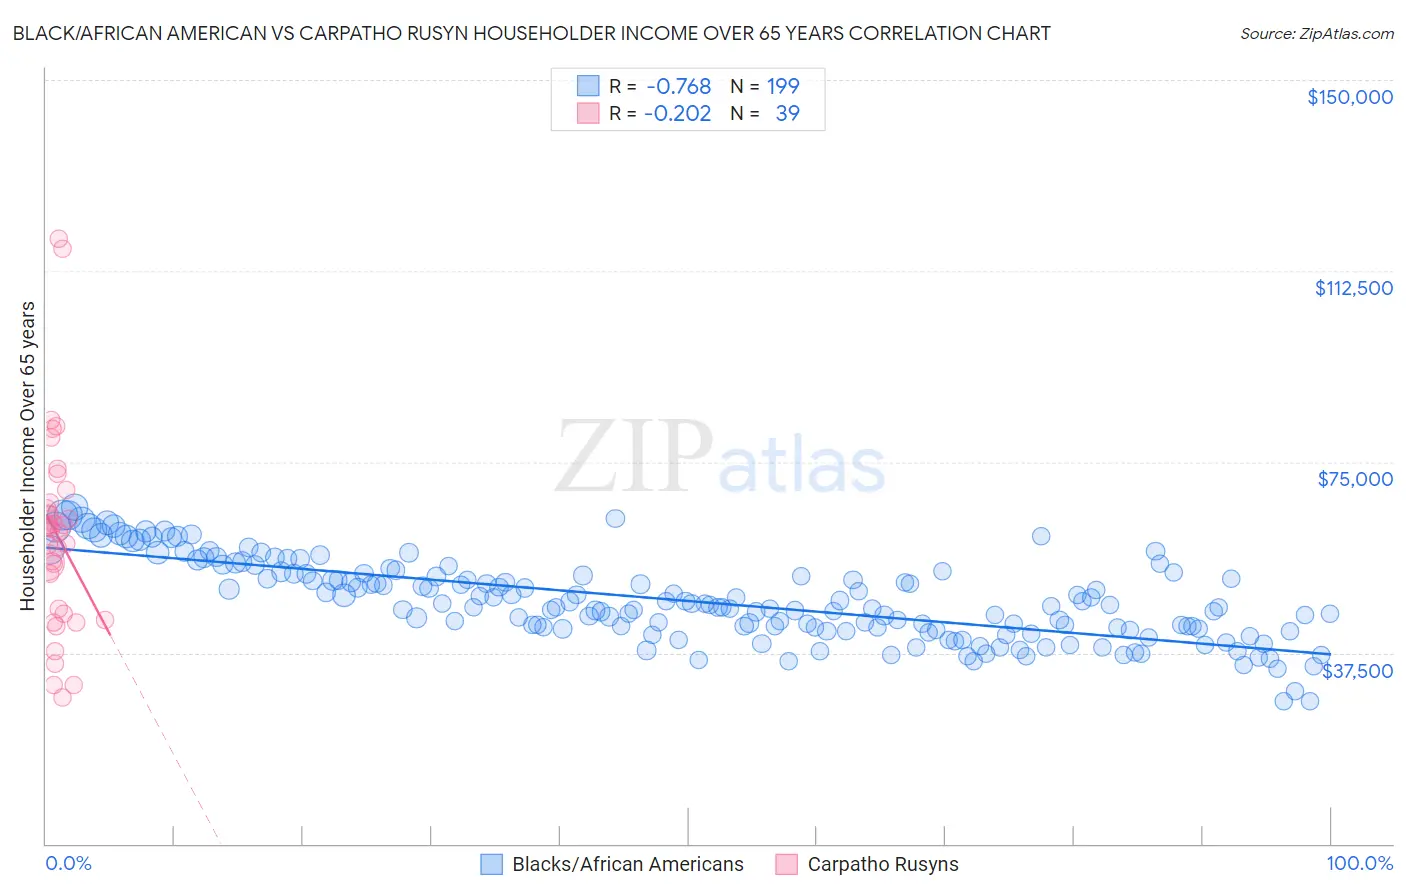
Black/African American vs Carpatho Rusyn Householder Income Over 65 years Correlation Chart
The statistical analysis conducted on geographies consisting of 560,756,533 people shows a strong negative correlation between the proportion of Blacks/African Americans and household income with householder over the age of 65 in the United States with a correlation coefficient (R) of -0.768 and weighted average of $50,779. Similarly, the statistical analysis conducted on geographies consisting of 58,852,207 people shows a weak negative correlation between the proportion of Carpatho Rusyns and household income with householder over the age of 65 in the United States with a correlation coefficient (R) of -0.202 and weighted average of $61,093, a difference of 20.3%.
Householder Income Over 65 years Correlation Summary
| Measurement | Black/African American | Carpatho Rusyn |
| Minimum | $27,967 | $28,606 |
| Maximum | $66,084 | $118,750 |
| Range | $38,117 | $90,144 |
| Mean | $47,714 | $60,576 |
| Median | $46,741 | $61,884 |
| Interquartile 25% (IQ1) | $42,258 | $45,096 |
| Interquartile 75% (IQ3) | $52,943 | $66,922 |
| Interquartile Range (IQR) | $10,685 | $21,826 |
| Standard Deviation (Sample) | $7,891 | $19,565 |
| Standard Deviation (Population) | $7,872 | $19,313 |
Similar Demographics by Householder Income Over 65 years
Demographics Similar to Blacks/African Americans by Householder Income Over 65 years
In terms of householder income over 65 years, the demographic groups most similar to Blacks/African Americans are Immigrants from Grenada ($50,747, a difference of 0.060%), Hopi ($50,925, a difference of 0.29%), Bahamian ($51,000, a difference of 0.44%), Pima ($50,539, a difference of 0.47%), and Dutch West Indian ($50,475, a difference of 0.60%).
| Demographics | Rating | Rank | Householder Income Over 65 years |
| British West Indians | 0.0 /100 | #322 | Tragic $51,463 |
| Cajuns | 0.0 /100 | #323 | Tragic $51,397 |
| Immigrants | Congo | 0.0 /100 | #324 | Tragic $51,393 |
| Immigrants | Haiti | 0.0 /100 | #325 | Tragic $51,219 |
| Kiowa | 0.0 /100 | #326 | Tragic $51,140 |
| Bahamians | 0.0 /100 | #327 | Tragic $51,000 |
| Hopi | 0.0 /100 | #328 | Tragic $50,925 |
| Blacks/African Americans | 0.0 /100 | #329 | Tragic $50,779 |
| Immigrants | Grenada | 0.0 /100 | #330 | Tragic $50,747 |
| Pima | 0.0 /100 | #331 | Tragic $50,539 |
| Dutch West Indians | 0.0 /100 | #332 | Tragic $50,475 |
| Cape Verdeans | 0.0 /100 | #333 | Tragic $50,077 |
| Immigrants | Dominica | 0.0 /100 | #334 | Tragic $50,071 |
| Crow | 0.0 /100 | #335 | Tragic $49,234 |
| Cubans | 0.0 /100 | #336 | Tragic $49,152 |
Demographics Similar to Carpatho Rusyns by Householder Income Over 65 years
In terms of householder income over 65 years, the demographic groups most similar to Carpatho Rusyns are Irish ($61,097, a difference of 0.010%), Serbian ($61,087, a difference of 0.010%), Norwegian ($61,104, a difference of 0.020%), Inupiat ($61,061, a difference of 0.050%), and Immigrants from Poland ($61,041, a difference of 0.090%).
| Demographics | Rating | Rank | Householder Income Over 65 years |
| Czechs | 57.2 /100 | #162 | Average $61,244 |
| Ugandans | 55.5 /100 | #163 | Average $61,177 |
| Immigrants | North Macedonia | 55.4 /100 | #164 | Average $61,175 |
| Immigrants | Ukraine | 55.1 /100 | #165 | Average $61,163 |
| Immigrants | Eastern Africa | 55.0 /100 | #166 | Average $61,157 |
| Norwegians | 53.6 /100 | #167 | Average $61,104 |
| Irish | 53.4 /100 | #168 | Average $61,097 |
| Carpatho Rusyns | 53.3 /100 | #169 | Average $61,093 |
| Serbians | 53.1 /100 | #170 | Average $61,087 |
| Inupiat | 52.4 /100 | #171 | Average $61,061 |
| Immigrants | Poland | 51.9 /100 | #172 | Average $61,041 |
| Immigrants | Micronesia | 50.8 /100 | #173 | Average $61,000 |
| Luxembourgers | 50.0 /100 | #174 | Average $60,967 |
| Spaniards | 47.3 /100 | #175 | Average $60,866 |
| Spanish | 45.5 /100 | #176 | Average $60,795 |