Black/African American vs Paraguayan Householder Income Over 65 years
COMPARE
Black/African American
Paraguayan
Householder Income Over 65 years
Householder Income Over 65 years Comparison
Blacks/African Americans
Paraguayans
$50,779
HOUSEHOLDER INCOME OVER 65 YEARS
0.0/ 100
METRIC RATING
329th/ 347
METRIC RANK
$64,443
HOUSEHOLDER INCOME OVER 65 YEARS
97.4/ 100
METRIC RATING
89th/ 347
METRIC RANK
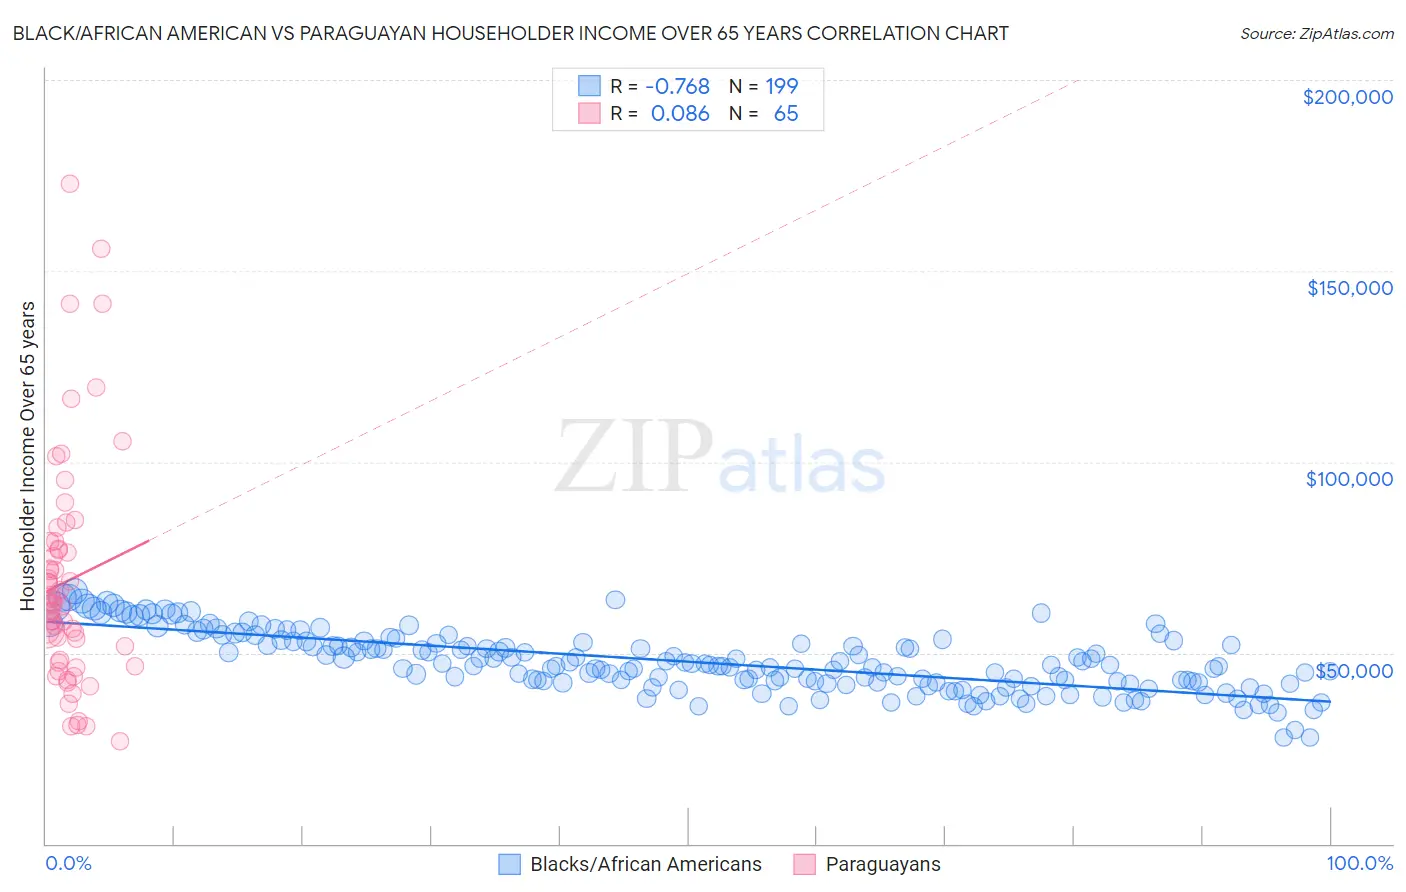
Black/African American vs Paraguayan Householder Income Over 65 years Correlation Chart
The statistical analysis conducted on geographies consisting of 560,756,533 people shows a strong negative correlation between the proportion of Blacks/African Americans and household income with householder over the age of 65 in the United States with a correlation coefficient (R) of -0.768 and weighted average of $50,779. Similarly, the statistical analysis conducted on geographies consisting of 95,003,306 people shows a slight positive correlation between the proportion of Paraguayans and household income with householder over the age of 65 in the United States with a correlation coefficient (R) of 0.086 and weighted average of $64,443, a difference of 26.9%.
Householder Income Over 65 years Correlation Summary
| Measurement | Black/African American | Paraguayan |
| Minimum | $27,967 | $26,765 |
| Maximum | $66,084 | $172,969 |
| Range | $38,117 | $146,204 |
| Mean | $47,714 | $68,770 |
| Median | $46,741 | $63,287 |
| Interquartile 25% (IQ1) | $42,258 | $47,789 |
| Interquartile 75% (IQ3) | $52,943 | $78,220 |
| Interquartile Range (IQR) | $10,685 | $30,430 |
| Standard Deviation (Sample) | $7,891 | $29,858 |
| Standard Deviation (Population) | $7,872 | $29,627 |
Similar Demographics by Householder Income Over 65 years
Demographics Similar to Blacks/African Americans by Householder Income Over 65 years
In terms of householder income over 65 years, the demographic groups most similar to Blacks/African Americans are Immigrants from Grenada ($50,747, a difference of 0.060%), Hopi ($50,925, a difference of 0.29%), Bahamian ($51,000, a difference of 0.44%), Pima ($50,539, a difference of 0.47%), and Dutch West Indian ($50,475, a difference of 0.60%).
| Demographics | Rating | Rank | Householder Income Over 65 years |
| British West Indians | 0.0 /100 | #322 | Tragic $51,463 |
| Cajuns | 0.0 /100 | #323 | Tragic $51,397 |
| Immigrants | Congo | 0.0 /100 | #324 | Tragic $51,393 |
| Immigrants | Haiti | 0.0 /100 | #325 | Tragic $51,219 |
| Kiowa | 0.0 /100 | #326 | Tragic $51,140 |
| Bahamians | 0.0 /100 | #327 | Tragic $51,000 |
| Hopi | 0.0 /100 | #328 | Tragic $50,925 |
| Blacks/African Americans | 0.0 /100 | #329 | Tragic $50,779 |
| Immigrants | Grenada | 0.0 /100 | #330 | Tragic $50,747 |
| Pima | 0.0 /100 | #331 | Tragic $50,539 |
| Dutch West Indians | 0.0 /100 | #332 | Tragic $50,475 |
| Cape Verdeans | 0.0 /100 | #333 | Tragic $50,077 |
| Immigrants | Dominica | 0.0 /100 | #334 | Tragic $50,071 |
| Crow | 0.0 /100 | #335 | Tragic $49,234 |
| Cubans | 0.0 /100 | #336 | Tragic $49,152 |
Demographics Similar to Paraguayans by Householder Income Over 65 years
In terms of householder income over 65 years, the demographic groups most similar to Paraguayans are Immigrants from Kuwait ($64,433, a difference of 0.020%), Immigrants from Romania ($64,462, a difference of 0.030%), Austrian ($64,470, a difference of 0.040%), Immigrants from Oceania ($64,416, a difference of 0.040%), and Immigrants from Bulgaria ($64,379, a difference of 0.10%).
| Demographics | Rating | Rank | Householder Income Over 65 years |
| Immigrants | Fiji | 98.2 /100 | #82 | Exceptional $64,795 |
| Northern Europeans | 97.9 /100 | #83 | Exceptional $64,658 |
| Immigrants | Greece | 97.9 /100 | #84 | Exceptional $64,636 |
| Immigrants | Lebanon | 97.6 /100 | #85 | Exceptional $64,521 |
| Immigrants | Russia | 97.6 /100 | #86 | Exceptional $64,512 |
| Austrians | 97.5 /100 | #87 | Exceptional $64,470 |
| Immigrants | Romania | 97.5 /100 | #88 | Exceptional $64,462 |
| Paraguayans | 97.4 /100 | #89 | Exceptional $64,443 |
| Immigrants | Kuwait | 97.4 /100 | #90 | Exceptional $64,433 |
| Immigrants | Oceania | 97.4 /100 | #91 | Exceptional $64,416 |
| Immigrants | Bulgaria | 97.3 /100 | #92 | Exceptional $64,379 |
| Jordanians | 97.1 /100 | #93 | Exceptional $64,313 |
| Immigrants | Egypt | 97.0 /100 | #94 | Exceptional $64,299 |
| Immigrants | Latvia | 97.0 /100 | #95 | Exceptional $64,298 |
| Immigrants | Hungary | 97.0 /100 | #96 | Exceptional $64,277 |