Black/African American vs Arab Householder Income Over 65 years
COMPARE
Black/African American
Arab
Householder Income Over 65 years
Householder Income Over 65 years Comparison
Blacks/African Americans
Arabs
$50,779
HOUSEHOLDER INCOME OVER 65 YEARS
0.0/ 100
METRIC RATING
329th/ 347
METRIC RANK
$62,266
HOUSEHOLDER INCOME OVER 65 YEARS
79.6/ 100
METRIC RATING
140th/ 347
METRIC RANK
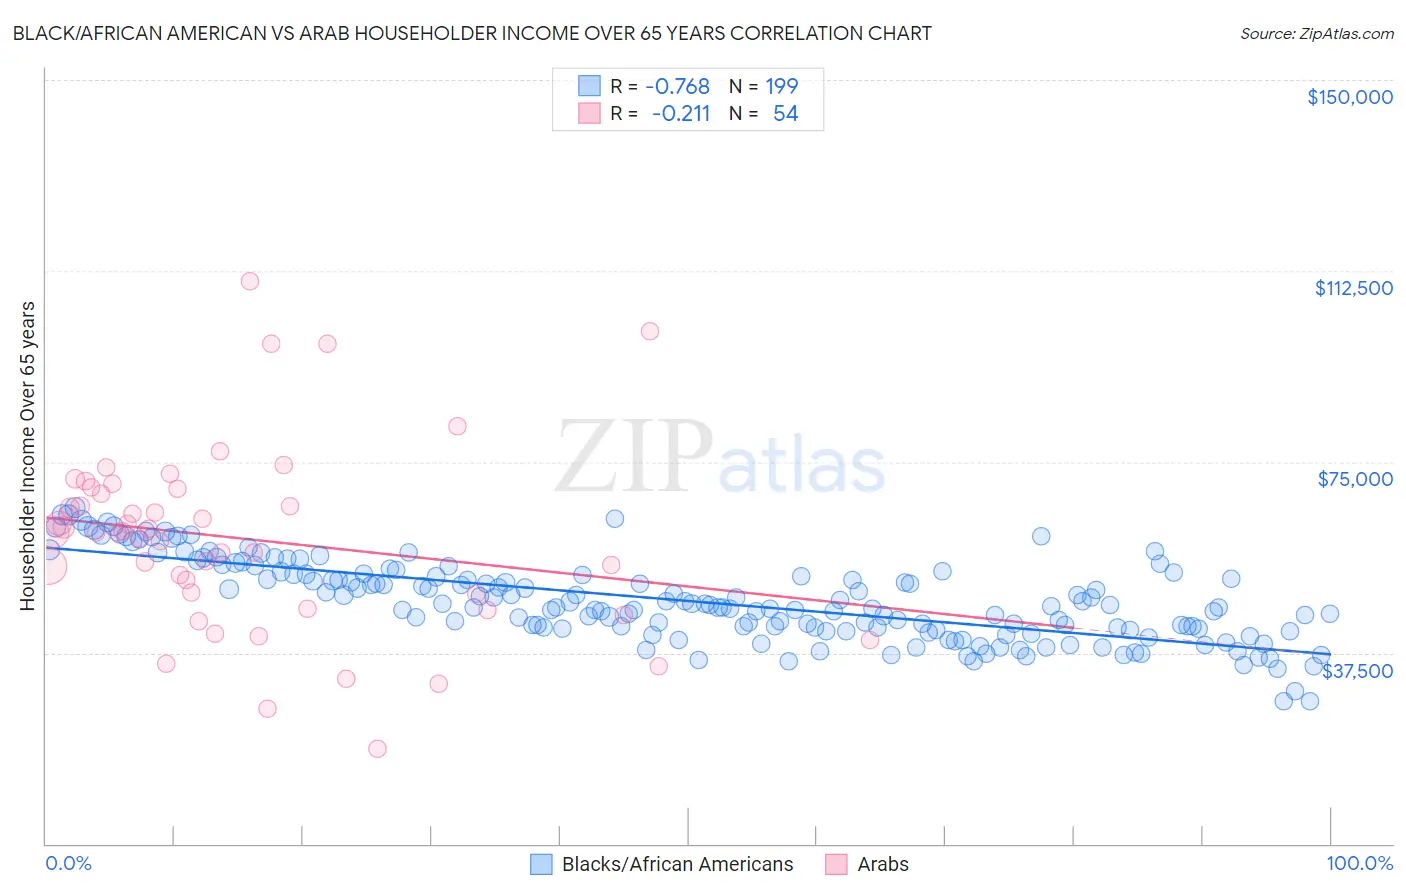
Black/African American vs Arab Householder Income Over 65 years Correlation Chart
The statistical analysis conducted on geographies consisting of 560,756,533 people shows a strong negative correlation between the proportion of Blacks/African Americans and household income with householder over the age of 65 in the United States with a correlation coefficient (R) of -0.768 and weighted average of $50,779. Similarly, the statistical analysis conducted on geographies consisting of 484,580,257 people shows a weak negative correlation between the proportion of Arabs and household income with householder over the age of 65 in the United States with a correlation coefficient (R) of -0.211 and weighted average of $62,266, a difference of 22.6%.
Householder Income Over 65 years Correlation Summary
| Measurement | Black/African American | Arab |
| Minimum | $27,967 | $18,625 |
| Maximum | $66,084 | $110,553 |
| Range | $38,117 | $91,928 |
| Mean | $47,714 | $59,915 |
| Median | $46,741 | $61,186 |
| Interquartile 25% (IQ1) | $42,258 | $48,984 |
| Interquartile 75% (IQ3) | $52,943 | $69,644 |
| Interquartile Range (IQR) | $10,685 | $20,660 |
| Standard Deviation (Sample) | $7,891 | $18,146 |
| Standard Deviation (Population) | $7,872 | $17,978 |
Similar Demographics by Householder Income Over 65 years
Demographics Similar to Blacks/African Americans by Householder Income Over 65 years
In terms of householder income over 65 years, the demographic groups most similar to Blacks/African Americans are Immigrants from Grenada ($50,747, a difference of 0.060%), Hopi ($50,925, a difference of 0.29%), Bahamian ($51,000, a difference of 0.44%), Pima ($50,539, a difference of 0.47%), and Dutch West Indian ($50,475, a difference of 0.60%).
| Demographics | Rating | Rank | Householder Income Over 65 years |
| British West Indians | 0.0 /100 | #322 | Tragic $51,463 |
| Cajuns | 0.0 /100 | #323 | Tragic $51,397 |
| Immigrants | Congo | 0.0 /100 | #324 | Tragic $51,393 |
| Immigrants | Haiti | 0.0 /100 | #325 | Tragic $51,219 |
| Kiowa | 0.0 /100 | #326 | Tragic $51,140 |
| Bahamians | 0.0 /100 | #327 | Tragic $51,000 |
| Hopi | 0.0 /100 | #328 | Tragic $50,925 |
| Blacks/African Americans | 0.0 /100 | #329 | Tragic $50,779 |
| Immigrants | Grenada | 0.0 /100 | #330 | Tragic $50,747 |
| Pima | 0.0 /100 | #331 | Tragic $50,539 |
| Dutch West Indians | 0.0 /100 | #332 | Tragic $50,475 |
| Cape Verdeans | 0.0 /100 | #333 | Tragic $50,077 |
| Immigrants | Dominica | 0.0 /100 | #334 | Tragic $50,071 |
| Crow | 0.0 /100 | #335 | Tragic $49,234 |
| Cubans | 0.0 /100 | #336 | Tragic $49,152 |
Demographics Similar to Arabs by Householder Income Over 65 years
In terms of householder income over 65 years, the demographic groups most similar to Arabs are Lebanese ($62,287, a difference of 0.030%), Immigrants from Kazakhstan ($62,292, a difference of 0.040%), Immigrants from Syria ($62,303, a difference of 0.060%), Canadian ($62,230, a difference of 0.060%), and South American Indian ($62,215, a difference of 0.080%).
| Demographics | Rating | Rank | Householder Income Over 65 years |
| Immigrants | Northern Africa | 83.6 /100 | #133 | Excellent $62,522 |
| Immigrants | Brazil | 81.2 /100 | #134 | Excellent $62,364 |
| Immigrants | Chile | 81.0 /100 | #135 | Excellent $62,354 |
| Alaskan Athabascans | 80.6 /100 | #136 | Excellent $62,330 |
| Immigrants | Syria | 80.2 /100 | #137 | Excellent $62,303 |
| Immigrants | Kazakhstan | 80.0 /100 | #138 | Excellent $62,292 |
| Lebanese | 79.9 /100 | #139 | Good $62,287 |
| Arabs | 79.6 /100 | #140 | Good $62,266 |
| Canadians | 79.0 /100 | #141 | Good $62,230 |
| South American Indians | 78.7 /100 | #142 | Good $62,215 |
| Immigrants | Belarus | 77.8 /100 | #143 | Good $62,162 |
| Immigrants | Peru | 74.4 /100 | #144 | Good $61,988 |
| Immigrants | Uganda | 74.2 /100 | #145 | Good $61,976 |
| Immigrants | Southern Europe | 72.7 /100 | #146 | Good $61,902 |
| Immigrants | Nepal | 71.4 /100 | #147 | Good $61,843 |