Bulgarian vs Ecuadorian Householder Income Over 65 years
COMPARE
Bulgarian
Ecuadorian
Householder Income Over 65 years
Householder Income Over 65 years Comparison
Bulgarians
Ecuadorians
$66,236
HOUSEHOLDER INCOME OVER 65 YEARS
99.6/ 100
METRIC RATING
57th/ 347
METRIC RANK
$54,958
HOUSEHOLDER INCOME OVER 65 YEARS
0.2/ 100
METRIC RATING
258th/ 347
METRIC RANK
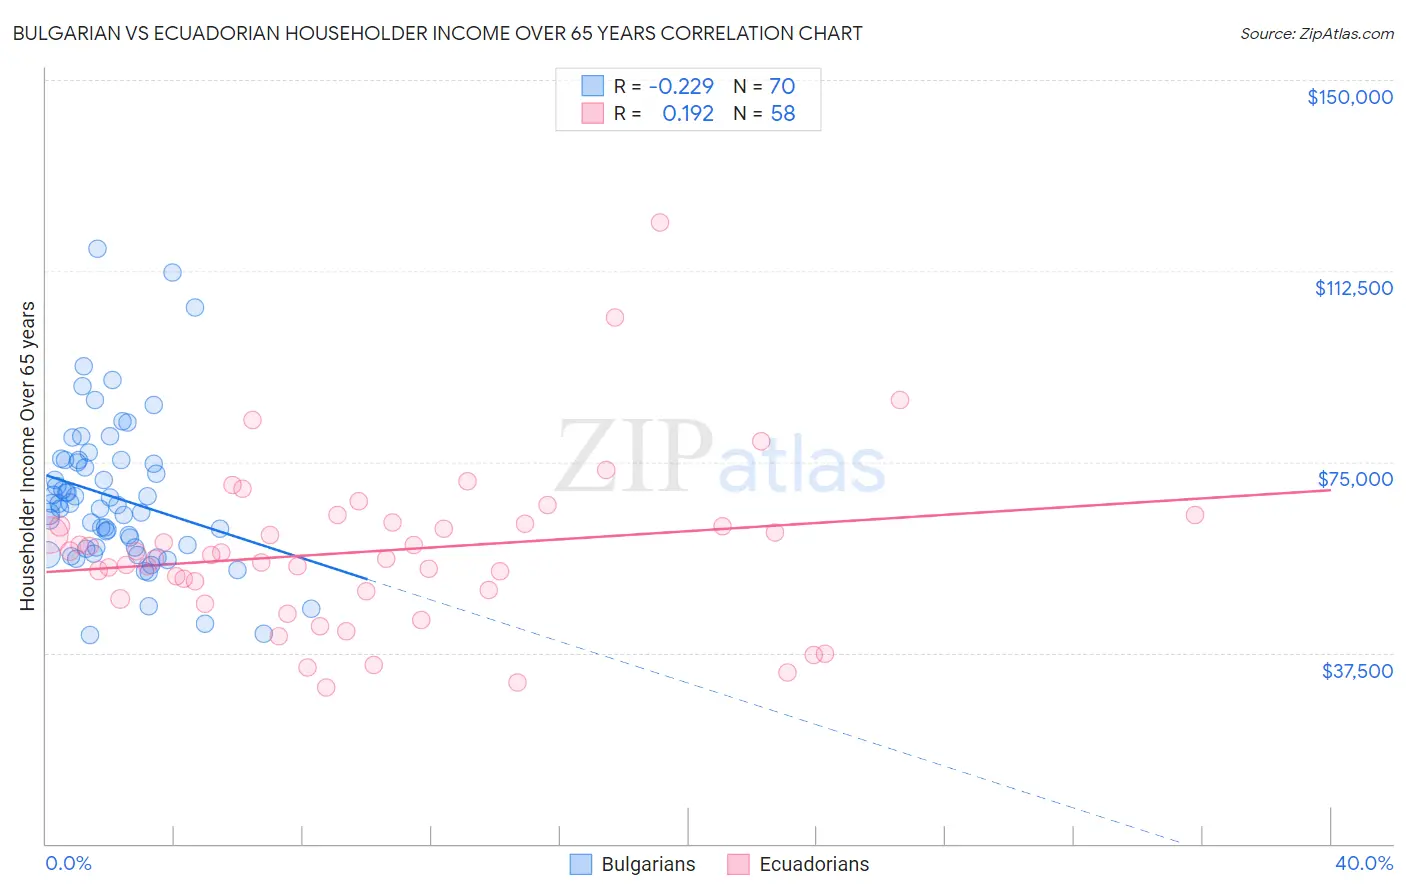
Bulgarian vs Ecuadorian Householder Income Over 65 years Correlation Chart
The statistical analysis conducted on geographies consisting of 205,399,104 people shows a weak negative correlation between the proportion of Bulgarians and household income with householder over the age of 65 in the United States with a correlation coefficient (R) of -0.229 and weighted average of $66,236. Similarly, the statistical analysis conducted on geographies consisting of 316,764,939 people shows a poor positive correlation between the proportion of Ecuadorians and household income with householder over the age of 65 in the United States with a correlation coefficient (R) of 0.192 and weighted average of $54,958, a difference of 20.5%.
Householder Income Over 65 years Correlation Summary
| Measurement | Bulgarian | Ecuadorian |
| Minimum | $40,918 | $30,682 |
| Maximum | $116,874 | $121,912 |
| Range | $75,956 | $91,230 |
| Mean | $68,096 | $57,458 |
| Median | $66,678 | $56,254 |
| Interquartile 25% (IQ1) | $58,125 | $49,530 |
| Interquartile 75% (IQ3) | $75,296 | $62,875 |
| Interquartile Range (IQR) | $17,171 | $13,345 |
| Standard Deviation (Sample) | $14,736 | $16,134 |
| Standard Deviation (Population) | $14,630 | $15,994 |
Similar Demographics by Householder Income Over 65 years
Demographics Similar to Bulgarians by Householder Income Over 65 years
In terms of householder income over 65 years, the demographic groups most similar to Bulgarians are Laotian ($66,306, a difference of 0.11%), Immigrants from Philippines ($66,161, a difference of 0.11%), Immigrants from Norway ($66,118, a difference of 0.18%), Immigrants from Czechoslovakia ($66,376, a difference of 0.21%), and Immigrants from Lithuania ($66,087, a difference of 0.22%).
| Demographics | Rating | Rank | Householder Income Over 65 years |
| Immigrants | Turkey | 99.7 /100 | #50 | Exceptional $66,672 |
| Israelis | 99.7 /100 | #51 | Exceptional $66,636 |
| Immigrants | Scotland | 99.7 /100 | #52 | Exceptional $66,620 |
| Immigrants | Pakistan | 99.7 /100 | #53 | Exceptional $66,617 |
| Immigrants | Netherlands | 99.7 /100 | #54 | Exceptional $66,463 |
| Immigrants | Czechoslovakia | 99.7 /100 | #55 | Exceptional $66,376 |
| Laotians | 99.6 /100 | #56 | Exceptional $66,306 |
| Bulgarians | 99.6 /100 | #57 | Exceptional $66,236 |
| Immigrants | Philippines | 99.6 /100 | #58 | Exceptional $66,161 |
| Immigrants | Norway | 99.5 /100 | #59 | Exceptional $66,118 |
| Immigrants | Lithuania | 99.5 /100 | #60 | Exceptional $66,087 |
| Maltese | 99.5 /100 | #61 | Exceptional $66,027 |
| Immigrants | Sierra Leone | 99.5 /100 | #62 | Exceptional $66,009 |
| Marshallese | 99.4 /100 | #63 | Exceptional $65,874 |
| Zimbabweans | 99.4 /100 | #64 | Exceptional $65,854 |
Demographics Similar to Ecuadorians by Householder Income Over 65 years
In terms of householder income over 65 years, the demographic groups most similar to Ecuadorians are West Indian ($54,936, a difference of 0.040%), Immigrants from West Indies ($54,927, a difference of 0.060%), Comanche ($54,922, a difference of 0.070%), Bangladeshi ($54,719, a difference of 0.44%), and French American Indian ($54,699, a difference of 0.47%).
| Demographics | Rating | Rank | Householder Income Over 65 years |
| Immigrants | Portugal | 0.5 /100 | #251 | Tragic $55,924 |
| Osage | 0.4 /100 | #252 | Tragic $55,677 |
| Immigrants | Trinidad and Tobago | 0.4 /100 | #253 | Tragic $55,598 |
| Americans | 0.3 /100 | #254 | Tragic $55,527 |
| Immigrants | Bangladesh | 0.3 /100 | #255 | Tragic $55,394 |
| German Russians | 0.3 /100 | #256 | Tragic $55,356 |
| Trinidadians and Tobagonians | 0.3 /100 | #257 | Tragic $55,327 |
| Ecuadorians | 0.2 /100 | #258 | Tragic $54,958 |
| West Indians | 0.2 /100 | #259 | Tragic $54,936 |
| Immigrants | West Indies | 0.2 /100 | #260 | Tragic $54,927 |
| Comanche | 0.2 /100 | #261 | Tragic $54,922 |
| Bangladeshis | 0.1 /100 | #262 | Tragic $54,719 |
| French American Indians | 0.1 /100 | #263 | Tragic $54,699 |
| Apache | 0.1 /100 | #264 | Tragic $54,668 |
| Belizeans | 0.1 /100 | #265 | Tragic $54,580 |