Black/African American vs Ottawa Householder Income Over 65 years
COMPARE
Black/African American
Ottawa
Householder Income Over 65 years
Householder Income Over 65 years Comparison
Blacks/African Americans
Ottawa
$50,779
HOUSEHOLDER INCOME OVER 65 YEARS
0.0/ 100
METRIC RATING
329th/ 347
METRIC RANK
$53,217
HOUSEHOLDER INCOME OVER 65 YEARS
0.0/ 100
METRIC RATING
299th/ 347
METRIC RANK
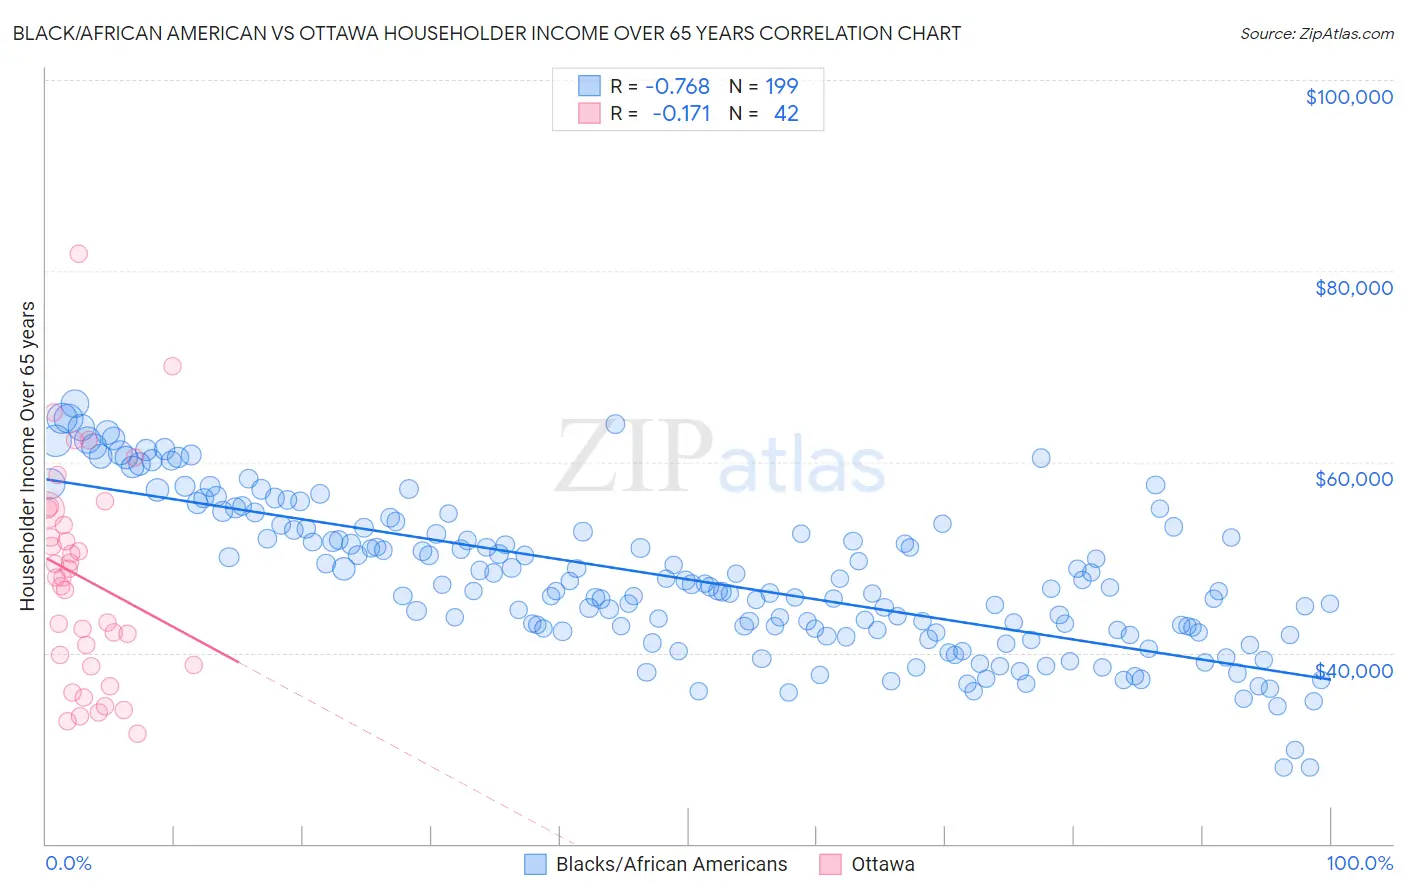
Black/African American vs Ottawa Householder Income Over 65 years Correlation Chart
The statistical analysis conducted on geographies consisting of 560,756,533 people shows a strong negative correlation between the proportion of Blacks/African Americans and household income with householder over the age of 65 in the United States with a correlation coefficient (R) of -0.768 and weighted average of $50,779. Similarly, the statistical analysis conducted on geographies consisting of 49,912,496 people shows a poor negative correlation between the proportion of Ottawa and household income with householder over the age of 65 in the United States with a correlation coefficient (R) of -0.171 and weighted average of $53,217, a difference of 4.8%.
Householder Income Over 65 years Correlation Summary
| Measurement | Black/African American | Ottawa |
| Minimum | $27,967 | $31,583 |
| Maximum | $66,084 | $81,786 |
| Range | $38,117 | $50,203 |
| Mean | $47,714 | $47,771 |
| Median | $46,741 | $47,868 |
| Interquartile 25% (IQ1) | $42,258 | $38,750 |
| Interquartile 75% (IQ3) | $52,943 | $54,962 |
| Interquartile Range (IQR) | $10,685 | $16,212 |
| Standard Deviation (Sample) | $7,891 | $11,126 |
| Standard Deviation (Population) | $7,872 | $10,993 |
Similar Demographics by Householder Income Over 65 years
Demographics Similar to Blacks/African Americans by Householder Income Over 65 years
In terms of householder income over 65 years, the demographic groups most similar to Blacks/African Americans are Immigrants from Grenada ($50,747, a difference of 0.060%), Hopi ($50,925, a difference of 0.29%), Bahamian ($51,000, a difference of 0.44%), Pima ($50,539, a difference of 0.47%), and Dutch West Indian ($50,475, a difference of 0.60%).
| Demographics | Rating | Rank | Householder Income Over 65 years |
| British West Indians | 0.0 /100 | #322 | Tragic $51,463 |
| Cajuns | 0.0 /100 | #323 | Tragic $51,397 |
| Immigrants | Congo | 0.0 /100 | #324 | Tragic $51,393 |
| Immigrants | Haiti | 0.0 /100 | #325 | Tragic $51,219 |
| Kiowa | 0.0 /100 | #326 | Tragic $51,140 |
| Bahamians | 0.0 /100 | #327 | Tragic $51,000 |
| Hopi | 0.0 /100 | #328 | Tragic $50,925 |
| Blacks/African Americans | 0.0 /100 | #329 | Tragic $50,779 |
| Immigrants | Grenada | 0.0 /100 | #330 | Tragic $50,747 |
| Pima | 0.0 /100 | #331 | Tragic $50,539 |
| Dutch West Indians | 0.0 /100 | #332 | Tragic $50,475 |
| Cape Verdeans | 0.0 /100 | #333 | Tragic $50,077 |
| Immigrants | Dominica | 0.0 /100 | #334 | Tragic $50,071 |
| Crow | 0.0 /100 | #335 | Tragic $49,234 |
| Cubans | 0.0 /100 | #336 | Tragic $49,152 |
Demographics Similar to Ottawa by Householder Income Over 65 years
In terms of householder income over 65 years, the demographic groups most similar to Ottawa are Central American Indian ($53,232, a difference of 0.030%), Immigrants from Bahamas ($53,174, a difference of 0.080%), Immigrants from Latin America ($53,265, a difference of 0.090%), Yuman ($53,110, a difference of 0.20%), and Immigrants from Somalia ($53,333, a difference of 0.22%).
| Demographics | Rating | Rank | Householder Income Over 65 years |
| Shoshone | 0.0 /100 | #292 | Tragic $53,681 |
| Immigrants | Belize | 0.0 /100 | #293 | Tragic $53,665 |
| Senegalese | 0.0 /100 | #294 | Tragic $53,591 |
| Immigrants | Central America | 0.0 /100 | #295 | Tragic $53,420 |
| Immigrants | Somalia | 0.0 /100 | #296 | Tragic $53,333 |
| Immigrants | Latin America | 0.0 /100 | #297 | Tragic $53,265 |
| Central American Indians | 0.0 /100 | #298 | Tragic $53,232 |
| Ottawa | 0.0 /100 | #299 | Tragic $53,217 |
| Immigrants | Bahamas | 0.0 /100 | #300 | Tragic $53,174 |
| Yuman | 0.0 /100 | #301 | Tragic $53,110 |
| Spanish American Indians | 0.0 /100 | #302 | Tragic $53,077 |
| Choctaw | 0.0 /100 | #303 | Tragic $53,060 |
| Ute | 0.0 /100 | #304 | Tragic $52,949 |
| Pueblo | 0.0 /100 | #305 | Tragic $52,930 |
| Pennsylvania Germans | 0.0 /100 | #306 | Tragic $52,888 |