Yaqui vs Ecuadorian Householder Income Over 65 years
COMPARE
Yaqui
Ecuadorian
Householder Income Over 65 years
Householder Income Over 65 years Comparison
Yaqui
Ecuadorians
$56,417
HOUSEHOLDER INCOME OVER 65 YEARS
0.8/ 100
METRIC RATING
242nd/ 347
METRIC RANK
$54,958
HOUSEHOLDER INCOME OVER 65 YEARS
0.2/ 100
METRIC RATING
258th/ 347
METRIC RANK
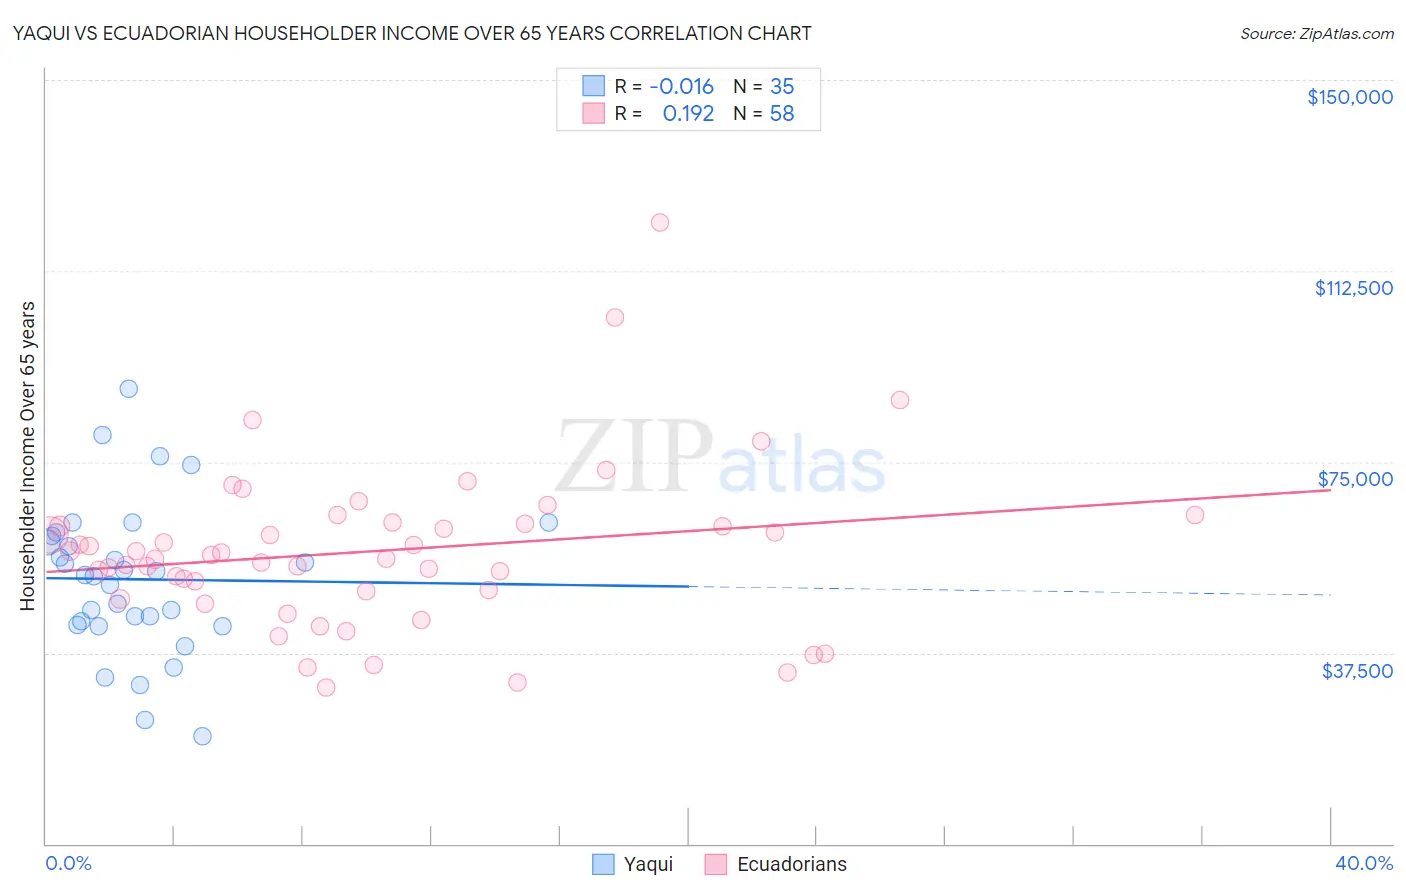
Yaqui vs Ecuadorian Householder Income Over 65 years Correlation Chart
The statistical analysis conducted on geographies consisting of 107,596,912 people shows no correlation between the proportion of Yaqui and household income with householder over the age of 65 in the United States with a correlation coefficient (R) of -0.016 and weighted average of $56,417. Similarly, the statistical analysis conducted on geographies consisting of 316,764,939 people shows a poor positive correlation between the proportion of Ecuadorians and household income with householder over the age of 65 in the United States with a correlation coefficient (R) of 0.192 and weighted average of $54,958, a difference of 2.6%.
Householder Income Over 65 years Correlation Summary
| Measurement | Yaqui | Ecuadorian |
| Minimum | $21,164 | $30,682 |
| Maximum | $89,308 | $121,912 |
| Range | $68,144 | $91,230 |
| Mean | $51,933 | $57,458 |
| Median | $52,760 | $56,254 |
| Interquartile 25% (IQ1) | $42,965 | $49,530 |
| Interquartile 75% (IQ3) | $60,509 | $62,875 |
| Interquartile Range (IQR) | $17,544 | $13,345 |
| Standard Deviation (Sample) | $14,813 | $16,134 |
| Standard Deviation (Population) | $14,600 | $15,994 |
Demographics Similar to Yaqui and Ecuadorians by Householder Income Over 65 years
In terms of householder income over 65 years, the demographic groups most similar to Yaqui are Guyanese ($56,351, a difference of 0.12%), Immigrants from Guyana ($56,495, a difference of 0.14%), Hmong ($56,339, a difference of 0.14%), Immigrants from Uzbekistan ($56,331, a difference of 0.15%), and Central American ($56,321, a difference of 0.17%). Similarly, the demographic groups most similar to Ecuadorians are West Indian ($54,936, a difference of 0.040%), Immigrants from West Indies ($54,927, a difference of 0.060%), Trinidadian and Tobagonian ($55,327, a difference of 0.67%), German Russian ($55,356, a difference of 0.72%), and Immigrants from Bangladesh ($55,394, a difference of 0.79%).
| Demographics | Rating | Rank | Householder Income Over 65 years |
| Sub-Saharan Africans | 1.0 /100 | #240 | Tragic $56,615 |
| Immigrants | Guyana | 0.9 /100 | #241 | Tragic $56,495 |
| Yaqui | 0.8 /100 | #242 | Tragic $56,417 |
| Guyanese | 0.8 /100 | #243 | Tragic $56,351 |
| Hmong | 0.8 /100 | #244 | Tragic $56,339 |
| Immigrants | Uzbekistan | 0.8 /100 | #245 | Tragic $56,331 |
| Central Americans | 0.8 /100 | #246 | Tragic $56,321 |
| Yakama | 0.7 /100 | #247 | Tragic $56,234 |
| Vietnamese | 0.6 /100 | #248 | Tragic $56,143 |
| Mexican American Indians | 0.6 /100 | #249 | Tragic $56,089 |
| Immigrants | Bosnia and Herzegovina | 0.5 /100 | #250 | Tragic $55,986 |
| Immigrants | Portugal | 0.5 /100 | #251 | Tragic $55,924 |
| Osage | 0.4 /100 | #252 | Tragic $55,677 |
| Immigrants | Trinidad and Tobago | 0.4 /100 | #253 | Tragic $55,598 |
| Americans | 0.3 /100 | #254 | Tragic $55,527 |
| Immigrants | Bangladesh | 0.3 /100 | #255 | Tragic $55,394 |
| German Russians | 0.3 /100 | #256 | Tragic $55,356 |
| Trinidadians and Tobagonians | 0.3 /100 | #257 | Tragic $55,327 |
| Ecuadorians | 0.2 /100 | #258 | Tragic $54,958 |
| West Indians | 0.2 /100 | #259 | Tragic $54,936 |
| Immigrants | West Indies | 0.2 /100 | #260 | Tragic $54,927 |