Black/African American vs Chilean Householder Income Over 65 years
COMPARE
Black/African American
Chilean
Householder Income Over 65 years
Householder Income Over 65 years Comparison
Blacks/African Americans
Chileans
$50,779
HOUSEHOLDER INCOME OVER 65 YEARS
0.0/ 100
METRIC RATING
329th/ 347
METRIC RANK
$63,957
HOUSEHOLDER INCOME OVER 65 YEARS
95.8/ 100
METRIC RATING
102nd/ 347
METRIC RANK
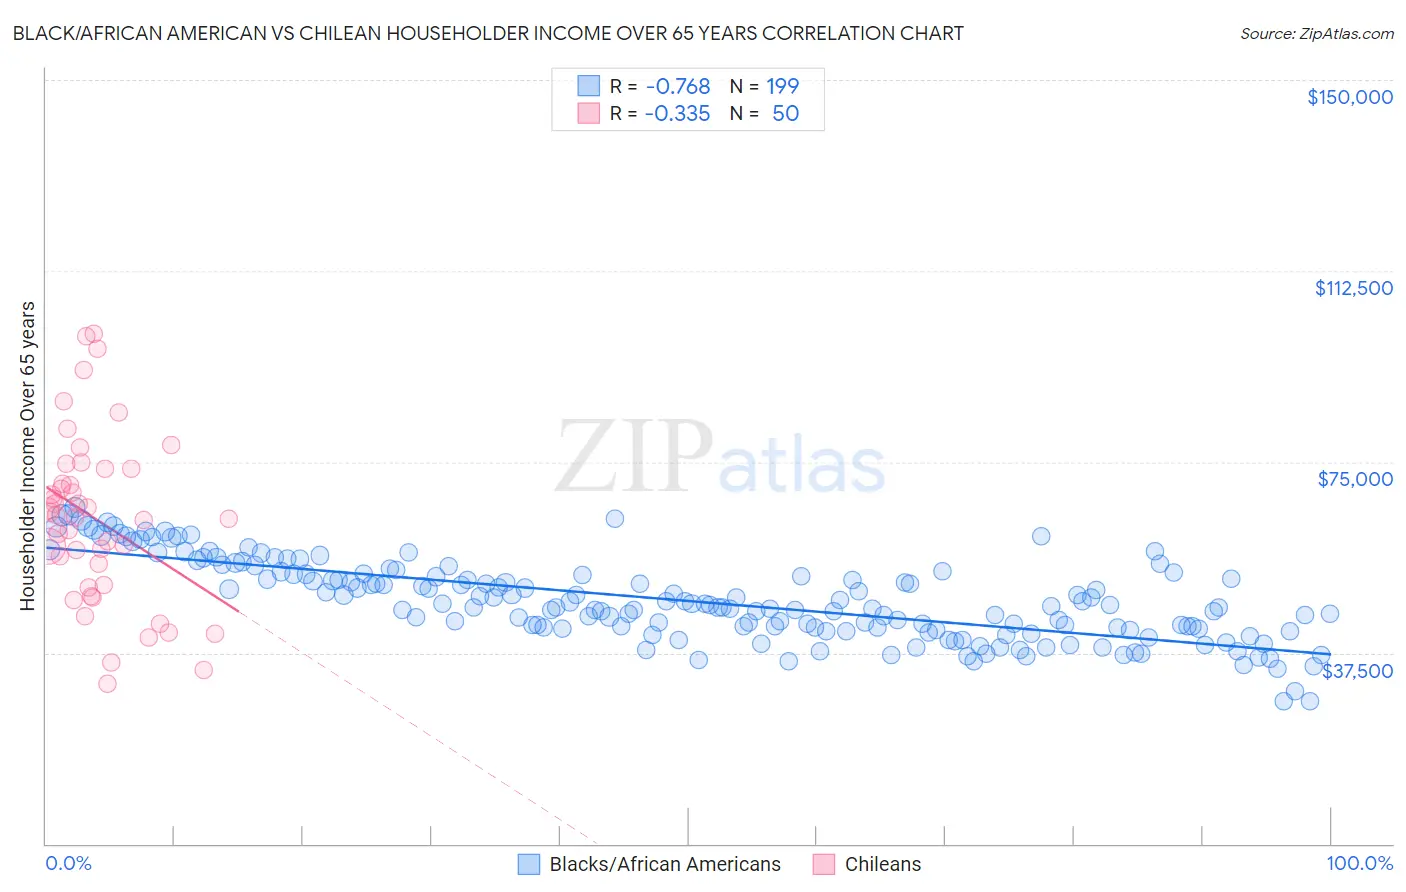
Black/African American vs Chilean Householder Income Over 65 years Correlation Chart
The statistical analysis conducted on geographies consisting of 560,756,533 people shows a strong negative correlation between the proportion of Blacks/African Americans and household income with householder over the age of 65 in the United States with a correlation coefficient (R) of -0.768 and weighted average of $50,779. Similarly, the statistical analysis conducted on geographies consisting of 256,269,150 people shows a mild negative correlation between the proportion of Chileans and household income with householder over the age of 65 in the United States with a correlation coefficient (R) of -0.335 and weighted average of $63,957, a difference of 26.0%.
Householder Income Over 65 years Correlation Summary
| Measurement | Black/African American | Chilean |
| Minimum | $27,967 | $31,406 |
| Maximum | $66,084 | $100,074 |
| Range | $38,117 | $68,668 |
| Mean | $47,714 | $63,656 |
| Median | $46,741 | $64,293 |
| Interquartile 25% (IQ1) | $42,258 | $50,804 |
| Interquartile 75% (IQ3) | $52,943 | $73,549 |
| Interquartile Range (IQR) | $10,685 | $22,745 |
| Standard Deviation (Sample) | $7,891 | $16,501 |
| Standard Deviation (Population) | $7,872 | $16,335 |
Similar Demographics by Householder Income Over 65 years
Demographics Similar to Blacks/African Americans by Householder Income Over 65 years
In terms of householder income over 65 years, the demographic groups most similar to Blacks/African Americans are Immigrants from Grenada ($50,747, a difference of 0.060%), Hopi ($50,925, a difference of 0.29%), Bahamian ($51,000, a difference of 0.44%), Pima ($50,539, a difference of 0.47%), and Dutch West Indian ($50,475, a difference of 0.60%).
| Demographics | Rating | Rank | Householder Income Over 65 years |
| British West Indians | 0.0 /100 | #322 | Tragic $51,463 |
| Cajuns | 0.0 /100 | #323 | Tragic $51,397 |
| Immigrants | Congo | 0.0 /100 | #324 | Tragic $51,393 |
| Immigrants | Haiti | 0.0 /100 | #325 | Tragic $51,219 |
| Kiowa | 0.0 /100 | #326 | Tragic $51,140 |
| Bahamians | 0.0 /100 | #327 | Tragic $51,000 |
| Hopi | 0.0 /100 | #328 | Tragic $50,925 |
| Blacks/African Americans | 0.0 /100 | #329 | Tragic $50,779 |
| Immigrants | Grenada | 0.0 /100 | #330 | Tragic $50,747 |
| Pima | 0.0 /100 | #331 | Tragic $50,539 |
| Dutch West Indians | 0.0 /100 | #332 | Tragic $50,475 |
| Cape Verdeans | 0.0 /100 | #333 | Tragic $50,077 |
| Immigrants | Dominica | 0.0 /100 | #334 | Tragic $50,071 |
| Crow | 0.0 /100 | #335 | Tragic $49,234 |
| Cubans | 0.0 /100 | #336 | Tragic $49,152 |
Demographics Similar to Chileans by Householder Income Over 65 years
In terms of householder income over 65 years, the demographic groups most similar to Chileans are British ($63,940, a difference of 0.030%), Immigrants from Cameroon ($63,907, a difference of 0.080%), Italian ($63,885, a difference of 0.11%), Immigrants from Argentina ($63,885, a difference of 0.11%), and Immigrants from Italy ($64,065, a difference of 0.17%).
| Demographics | Rating | Rank | Householder Income Over 65 years |
| Immigrants | Latvia | 97.0 /100 | #95 | Exceptional $64,298 |
| Immigrants | Hungary | 97.0 /100 | #96 | Exceptional $64,277 |
| Sri Lankans | 96.7 /100 | #97 | Exceptional $64,201 |
| Romanians | 96.5 /100 | #98 | Exceptional $64,142 |
| Assyrians/Chaldeans/Syriacs | 96.4 /100 | #99 | Exceptional $64,108 |
| Immigrants | South Eastern Asia | 96.3 /100 | #100 | Exceptional $64,089 |
| Immigrants | Italy | 96.2 /100 | #101 | Exceptional $64,065 |
| Chileans | 95.8 /100 | #102 | Exceptional $63,957 |
| British | 95.7 /100 | #103 | Exceptional $63,940 |
| Immigrants | Cameroon | 95.6 /100 | #104 | Exceptional $63,907 |
| Italians | 95.5 /100 | #105 | Exceptional $63,885 |
| Immigrants | Argentina | 95.5 /100 | #106 | Exceptional $63,885 |
| Pakistanis | 95.3 /100 | #107 | Exceptional $63,844 |
| Palestinians | 95.1 /100 | #108 | Exceptional $63,800 |
| Europeans | 95.0 /100 | #109 | Exceptional $63,779 |