Pennsylvania German vs Immigrants from Nepal College, Under 1 year
COMPARE
Pennsylvania German
Immigrants from Nepal
College, Under 1 year
College, Under 1 year Comparison
Pennsylvania Germans
Immigrants from Nepal
54.5%
COLLEGE, UNDER 1 YEAR
0.0/ 100
METRIC RATING
336th/ 347
METRIC RANK
67.5%
COLLEGE, UNDER 1 YEAR
94.9/ 100
METRIC RATING
116th/ 347
METRIC RANK
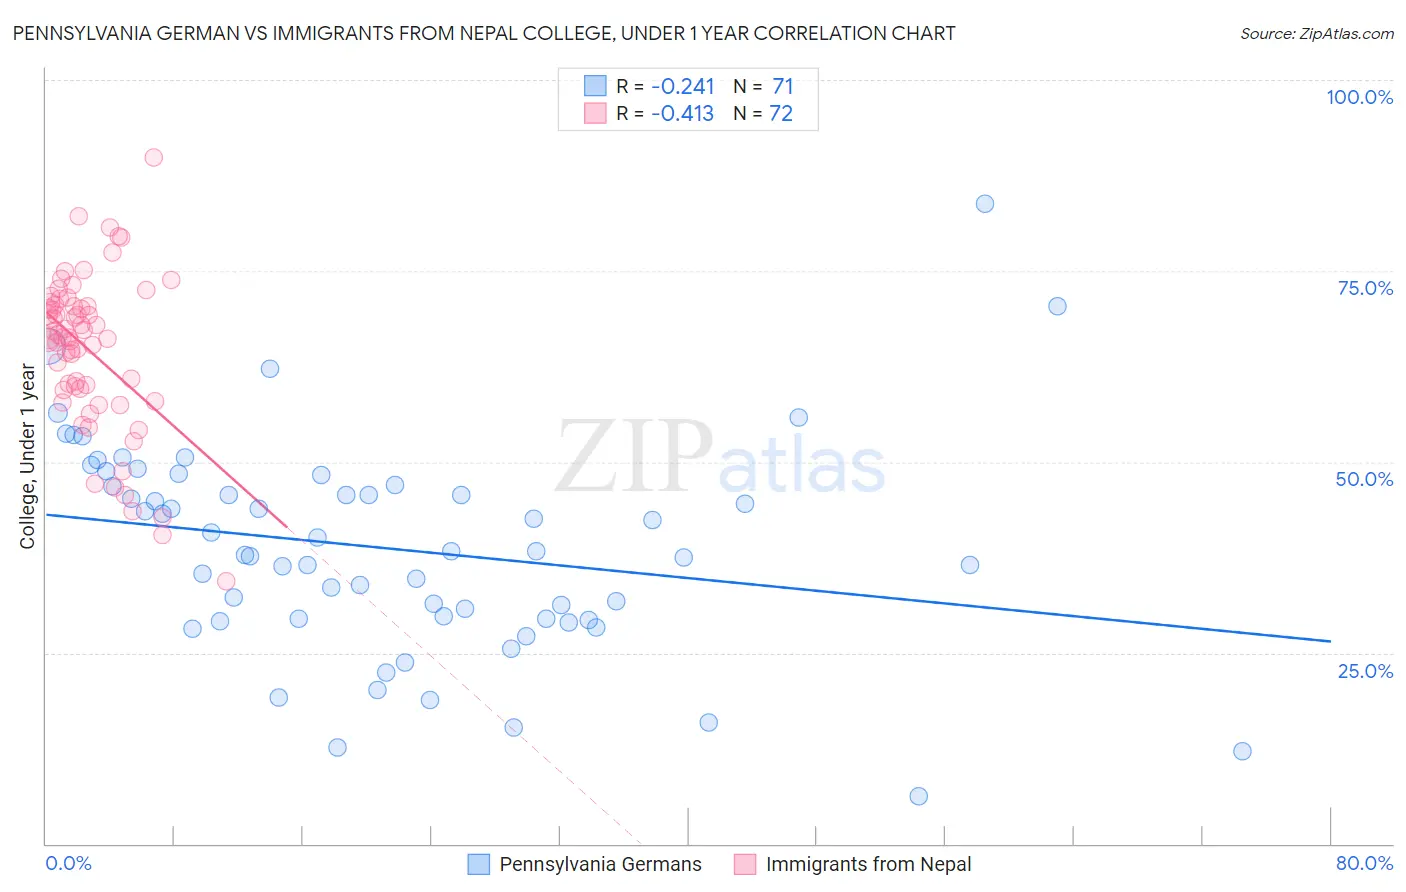
Pennsylvania German vs Immigrants from Nepal College, Under 1 year Correlation Chart
The statistical analysis conducted on geographies consisting of 234,102,446 people shows a weak negative correlation between the proportion of Pennsylvania Germans and percentage of population with at least college, under 1 year education in the United States with a correlation coefficient (R) of -0.241 and weighted average of 54.5%. Similarly, the statistical analysis conducted on geographies consisting of 186,775,596 people shows a moderate negative correlation between the proportion of Immigrants from Nepal and percentage of population with at least college, under 1 year education in the United States with a correlation coefficient (R) of -0.413 and weighted average of 67.5%, a difference of 23.8%.
College, Under 1 year Correlation Summary
| Measurement | Pennsylvania German | Immigrants from Nepal |
| Minimum | 6.2% | 34.4% |
| Maximum | 83.9% | 89.8% |
| Range | 77.6% | 55.5% |
| Mean | 38.7% | 64.6% |
| Median | 38.2% | 66.3% |
| Interquartile 25% (IQ1) | 29.4% | 59.5% |
| Interquartile 75% (IQ3) | 46.9% | 70.5% |
| Interquartile Range (IQR) | 17.5% | 11.0% |
| Standard Deviation (Sample) | 13.9% | 10.3% |
| Standard Deviation (Population) | 13.8% | 10.2% |
Similar Demographics by College, Under 1 year
Demographics Similar to Pennsylvania Germans by College, Under 1 year
In terms of college, under 1 year, the demographic groups most similar to Pennsylvania Germans are Immigrants from Central America (54.4%, a difference of 0.15%), Inupiat (54.6%, a difference of 0.17%), Immigrants from the Azores (54.7%, a difference of 0.30%), Lumbee (54.2%, a difference of 0.56%), and Immigrants from Dominican Republic (54.0%, a difference of 0.96%).
| Demographics | Rating | Rank | College, Under 1 year |
| Immigrants | Cuba | 0.0 /100 | #329 | Tragic 55.7% |
| Mexicans | 0.0 /100 | #330 | Tragic 55.6% |
| Dominicans | 0.0 /100 | #331 | Tragic 55.5% |
| Immigrants | Yemen | 0.0 /100 | #332 | Tragic 55.3% |
| Yuman | 0.0 /100 | #333 | Tragic 55.1% |
| Immigrants | Azores | 0.0 /100 | #334 | Tragic 54.7% |
| Inupiat | 0.0 /100 | #335 | Tragic 54.6% |
| Pennsylvania Germans | 0.0 /100 | #336 | Tragic 54.5% |
| Immigrants | Central America | 0.0 /100 | #337 | Tragic 54.4% |
| Lumbee | 0.0 /100 | #338 | Tragic 54.2% |
| Immigrants | Dominican Republic | 0.0 /100 | #339 | Tragic 54.0% |
| Spanish American Indians | 0.0 /100 | #340 | Tragic 54.0% |
| Immigrants | Cabo Verde | 0.0 /100 | #341 | Tragic 53.7% |
| Immigrants | Mexico | 0.0 /100 | #342 | Tragic 53.7% |
| Tohono O'odham | 0.0 /100 | #343 | Tragic 52.8% |
Demographics Similar to Immigrants from Nepal by College, Under 1 year
In terms of college, under 1 year, the demographic groups most similar to Immigrants from Nepal are Pakistani (67.5%, a difference of 0.020%), Immigrants from Ukraine (67.5%, a difference of 0.040%), Lebanese (67.5%, a difference of 0.060%), Basque (67.6%, a difference of 0.080%), and Chilean (67.6%, a difference of 0.090%).
| Demographics | Rating | Rank | College, Under 1 year |
| Scandinavians | 95.8 /100 | #109 | Exceptional 67.7% |
| Assyrians/Chaldeans/Syriacs | 95.8 /100 | #110 | Exceptional 67.7% |
| Ukrainians | 95.8 /100 | #111 | Exceptional 67.7% |
| Macedonians | 95.7 /100 | #112 | Exceptional 67.6% |
| Syrians | 95.6 /100 | #113 | Exceptional 67.6% |
| Chileans | 95.3 /100 | #114 | Exceptional 67.6% |
| Basques | 95.2 /100 | #115 | Exceptional 67.6% |
| Immigrants | Nepal | 94.9 /100 | #116 | Exceptional 67.5% |
| Pakistanis | 94.8 /100 | #117 | Exceptional 67.5% |
| Immigrants | Ukraine | 94.7 /100 | #118 | Exceptional 67.5% |
| Lebanese | 94.6 /100 | #119 | Exceptional 67.5% |
| Serbians | 93.9 /100 | #120 | Exceptional 67.4% |
| Slovenes | 93.3 /100 | #121 | Exceptional 67.3% |
| Immigrants | Jordan | 92.8 /100 | #122 | Exceptional 67.3% |
| Immigrants | Northern Africa | 92.7 /100 | #123 | Exceptional 67.2% |