Native Hawaiian vs Danish College, Under 1 year
COMPARE
Native Hawaiian
Danish
College, Under 1 year
College, Under 1 year Comparison
Native Hawaiians
Danes
63.9%
COLLEGE, UNDER 1 YEAR
10.6/ 100
METRIC RATING
211th/ 347
METRIC RANK
68.5%
COLLEGE, UNDER 1 YEAR
98.6/ 100
METRIC RATING
78th/ 347
METRIC RANK
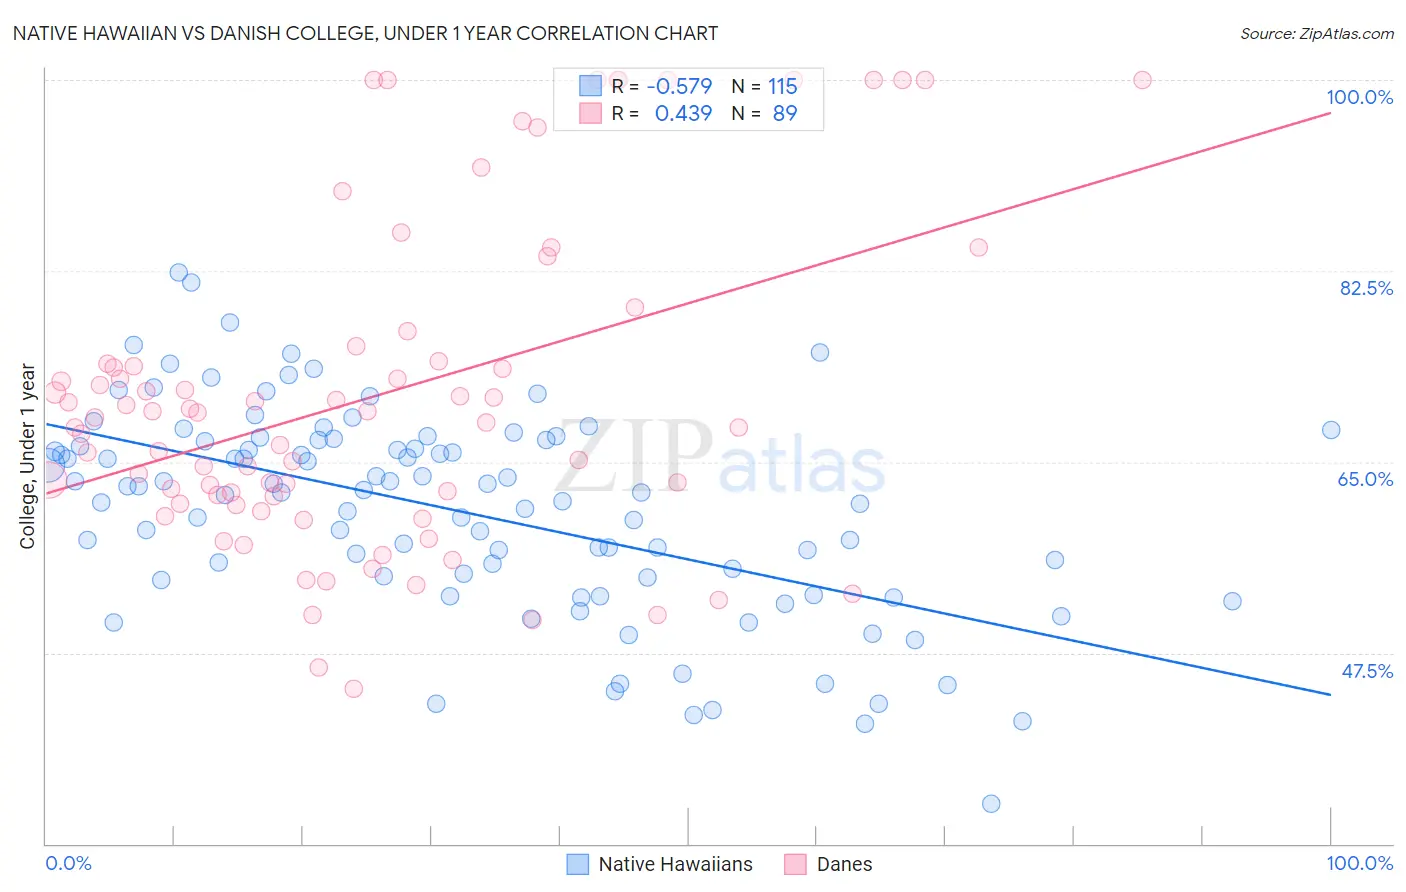
Native Hawaiian vs Danish College, Under 1 year Correlation Chart
The statistical analysis conducted on geographies consisting of 332,118,930 people shows a substantial negative correlation between the proportion of Native Hawaiians and percentage of population with at least college, under 1 year education in the United States with a correlation coefficient (R) of -0.579 and weighted average of 63.9%. Similarly, the statistical analysis conducted on geographies consisting of 474,193,485 people shows a moderate positive correlation between the proportion of Danes and percentage of population with at least college, under 1 year education in the United States with a correlation coefficient (R) of 0.439 and weighted average of 68.5%, a difference of 7.2%.
College, Under 1 year Correlation Summary
| Measurement | Native Hawaiian | Danish |
| Minimum | 33.7% | 44.2% |
| Maximum | 82.3% | 100.0% |
| Range | 48.7% | 55.8% |
| Mean | 60.5% | 71.0% |
| Median | 62.2% | 69.1% |
| Interquartile 25% (IQ1) | 54.4% | 61.5% |
| Interquartile 75% (IQ3) | 67.0% | 74.9% |
| Interquartile Range (IQR) | 12.6% | 13.4% |
| Standard Deviation (Sample) | 9.4% | 14.8% |
| Standard Deviation (Population) | 9.4% | 14.7% |
Similar Demographics by College, Under 1 year
Demographics Similar to Native Hawaiians by College, Under 1 year
In terms of college, under 1 year, the demographic groups most similar to Native Hawaiians are Immigrants from Middle Africa (63.9%, a difference of 0.010%), Ghanaian (63.9%, a difference of 0.070%), Puget Sound Salish (63.9%, a difference of 0.080%), Immigrants from Vietnam (64.0%, a difference of 0.17%), and Immigrants from South America (63.8%, a difference of 0.19%).
| Demographics | Rating | Rank | College, Under 1 year |
| Immigrants | Zaire | 14.6 /100 | #204 | Poor 64.1% |
| Peruvians | 13.7 /100 | #205 | Poor 64.1% |
| Whites/Caucasians | 12.8 /100 | #206 | Poor 64.0% |
| Colombians | 12.4 /100 | #207 | Poor 64.0% |
| Immigrants | Vietnam | 12.1 /100 | #208 | Poor 64.0% |
| Puget Sound Salish | 11.3 /100 | #209 | Poor 63.9% |
| Ghanaians | 11.2 /100 | #210 | Poor 63.9% |
| Native Hawaiians | 10.6 /100 | #211 | Poor 63.9% |
| Immigrants | Middle Africa | 10.5 /100 | #212 | Poor 63.9% |
| Immigrants | South America | 9.1 /100 | #213 | Tragic 63.8% |
| Immigrants | Nigeria | 8.8 /100 | #214 | Tragic 63.7% |
| Senegalese | 7.7 /100 | #215 | Tragic 63.6% |
| Hmong | 6.8 /100 | #216 | Tragic 63.5% |
| Immigrants | Uruguay | 5.8 /100 | #217 | Tragic 63.4% |
| Immigrants | Panama | 5.7 /100 | #218 | Tragic 63.4% |
Demographics Similar to Danes by College, Under 1 year
In terms of college, under 1 year, the demographic groups most similar to Danes are British (68.5%, a difference of 0.010%), Greek (68.5%, a difference of 0.010%), Immigrants from Spain (68.4%, a difference of 0.040%), Laotian (68.5%, a difference of 0.050%), and Immigrants from Western Europe (68.5%, a difference of 0.060%).
| Demographics | Rating | Rank | College, Under 1 year |
| Immigrants | Europe | 99.1 /100 | #71 | Exceptional 68.8% |
| Bolivians | 99.0 /100 | #72 | Exceptional 68.7% |
| Immigrants | England | 99.0 /100 | #73 | Exceptional 68.7% |
| Swedes | 98.9 /100 | #74 | Exceptional 68.7% |
| Immigrants | Western Europe | 98.6 /100 | #75 | Exceptional 68.5% |
| Laotians | 98.6 /100 | #76 | Exceptional 68.5% |
| British | 98.6 /100 | #77 | Exceptional 68.5% |
| Danes | 98.6 /100 | #78 | Exceptional 68.5% |
| Greeks | 98.6 /100 | #79 | Exceptional 68.5% |
| Immigrants | Spain | 98.5 /100 | #80 | Exceptional 68.4% |
| Immigrants | Greece | 98.5 /100 | #81 | Exceptional 68.4% |
| Norwegians | 98.4 /100 | #82 | Exceptional 68.4% |
| Argentineans | 98.4 /100 | #83 | Exceptional 68.4% |
| Immigrants | Hungary | 98.3 /100 | #84 | Exceptional 68.3% |
| Egyptians | 98.3 /100 | #85 | Exceptional 68.3% |