Haitian vs Cypriot College, Under 1 year
COMPARE
Haitian
Cypriot
College, Under 1 year
College, Under 1 year Comparison
Haitians
Cypriots
57.8%
COLLEGE, UNDER 1 YEAR
0.0/ 100
METRIC RATING
305th/ 347
METRIC RANK
72.0%
COLLEGE, UNDER 1 YEAR
100.0/ 100
METRIC RATING
13th/ 347
METRIC RANK
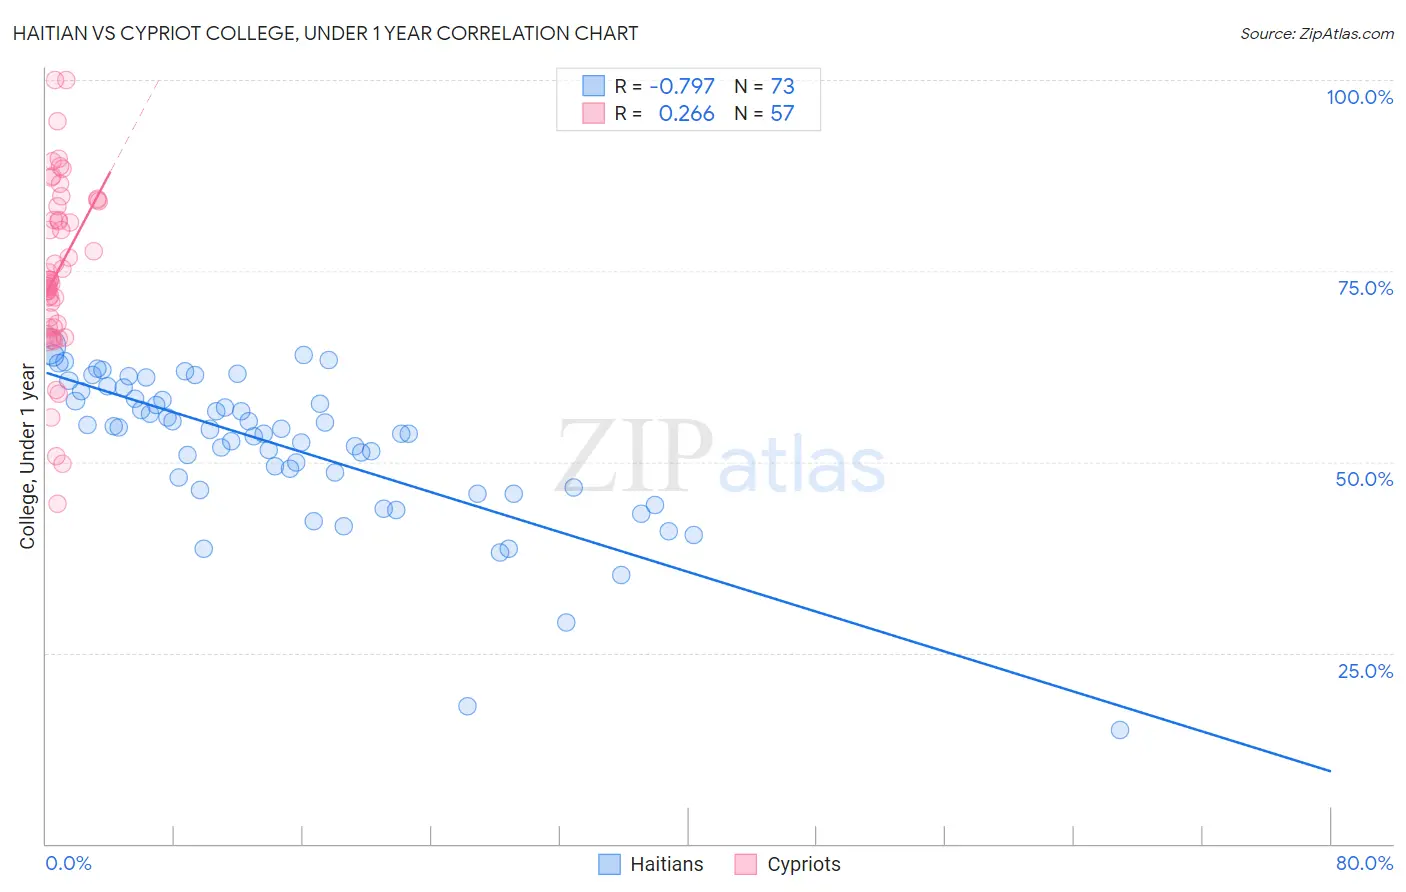
Haitian vs Cypriot College, Under 1 year Correlation Chart
The statistical analysis conducted on geographies consisting of 288,016,617 people shows a strong negative correlation between the proportion of Haitians and percentage of population with at least college, under 1 year education in the United States with a correlation coefficient (R) of -0.797 and weighted average of 57.8%. Similarly, the statistical analysis conducted on geographies consisting of 61,870,289 people shows a weak positive correlation between the proportion of Cypriots and percentage of population with at least college, under 1 year education in the United States with a correlation coefficient (R) of 0.266 and weighted average of 72.0%, a difference of 24.5%.
College, Under 1 year Correlation Summary
| Measurement | Haitian | Cypriot |
| Minimum | 14.8% | 44.5% |
| Maximum | 65.2% | 100.0% |
| Range | 50.4% | 55.5% |
| Mean | 52.0% | 74.9% |
| Median | 54.3% | 73.8% |
| Interquartile 25% (IQ1) | 46.5% | 67.6% |
| Interquartile 75% (IQ3) | 58.8% | 83.8% |
| Interquartile Range (IQR) | 12.3% | 16.2% |
| Standard Deviation (Sample) | 9.9% | 11.5% |
| Standard Deviation (Population) | 9.8% | 11.4% |
Similar Demographics by College, Under 1 year
Demographics Similar to Haitians by College, Under 1 year
In terms of college, under 1 year, the demographic groups most similar to Haitians are Kiowa (57.8%, a difference of 0.11%), Immigrants from Dominica (57.9%, a difference of 0.12%), Immigrants from Portugal (57.7%, a difference of 0.20%), Fijian (57.7%, a difference of 0.21%), and Central American (57.7%, a difference of 0.21%).
| Demographics | Rating | Rank | College, Under 1 year |
| Immigrants | Ecuador | 0.0 /100 | #298 | Tragic 58.7% |
| Cubans | 0.0 /100 | #299 | Tragic 58.6% |
| Immigrants | Guyana | 0.0 /100 | #300 | Tragic 58.5% |
| Mexican American Indians | 0.0 /100 | #301 | Tragic 58.1% |
| Apache | 0.0 /100 | #302 | Tragic 58.0% |
| Immigrants | Dominica | 0.0 /100 | #303 | Tragic 57.9% |
| Kiowa | 0.0 /100 | #304 | Tragic 57.8% |
| Haitians | 0.0 /100 | #305 | Tragic 57.8% |
| Immigrants | Portugal | 0.0 /100 | #306 | Tragic 57.7% |
| Fijians | 0.0 /100 | #307 | Tragic 57.7% |
| Central Americans | 0.0 /100 | #308 | Tragic 57.7% |
| Immigrants | Nicaragua | 0.0 /100 | #309 | Tragic 57.6% |
| Pueblo | 0.0 /100 | #310 | Tragic 57.4% |
| Cajuns | 0.0 /100 | #311 | Tragic 57.3% |
| Salvadorans | 0.0 /100 | #312 | Tragic 57.3% |
Demographics Similar to Cypriots by College, Under 1 year
In terms of college, under 1 year, the demographic groups most similar to Cypriots are Cambodian (71.9%, a difference of 0.12%), Burmese (71.9%, a difference of 0.12%), Immigrants from Japan (71.9%, a difference of 0.13%), Immigrants from South Central Asia (72.1%, a difference of 0.16%), and Immigrants from Sweden (72.1%, a difference of 0.16%).
| Demographics | Rating | Rank | College, Under 1 year |
| Immigrants | Taiwan | 100.0 /100 | #6 | Exceptional 74.2% |
| Okinawans | 100.0 /100 | #7 | Exceptional 73.7% |
| Thais | 100.0 /100 | #8 | Exceptional 73.4% |
| Immigrants | Australia | 100.0 /100 | #9 | Exceptional 72.7% |
| Immigrants | Israel | 100.0 /100 | #10 | Exceptional 72.3% |
| Immigrants | South Central Asia | 100.0 /100 | #11 | Exceptional 72.1% |
| Immigrants | Sweden | 100.0 /100 | #12 | Exceptional 72.1% |
| Cypriots | 100.0 /100 | #13 | Exceptional 72.0% |
| Cambodians | 100.0 /100 | #14 | Exceptional 71.9% |
| Burmese | 100.0 /100 | #15 | Exceptional 71.9% |
| Immigrants | Japan | 100.0 /100 | #16 | Exceptional 71.9% |
| Eastern Europeans | 100.0 /100 | #17 | Exceptional 71.8% |
| Immigrants | Switzerland | 100.0 /100 | #18 | Exceptional 71.7% |
| Latvians | 100.0 /100 | #19 | Exceptional 71.6% |
| Immigrants | Korea | 100.0 /100 | #20 | Exceptional 71.6% |