Haitian vs Native Hawaiian College, Under 1 year
COMPARE
Haitian
Native Hawaiian
College, Under 1 year
College, Under 1 year Comparison
Haitians
Native Hawaiians
57.8%
COLLEGE, UNDER 1 YEAR
0.0/ 100
METRIC RATING
305th/ 347
METRIC RANK
63.9%
COLLEGE, UNDER 1 YEAR
10.6/ 100
METRIC RATING
211th/ 347
METRIC RANK
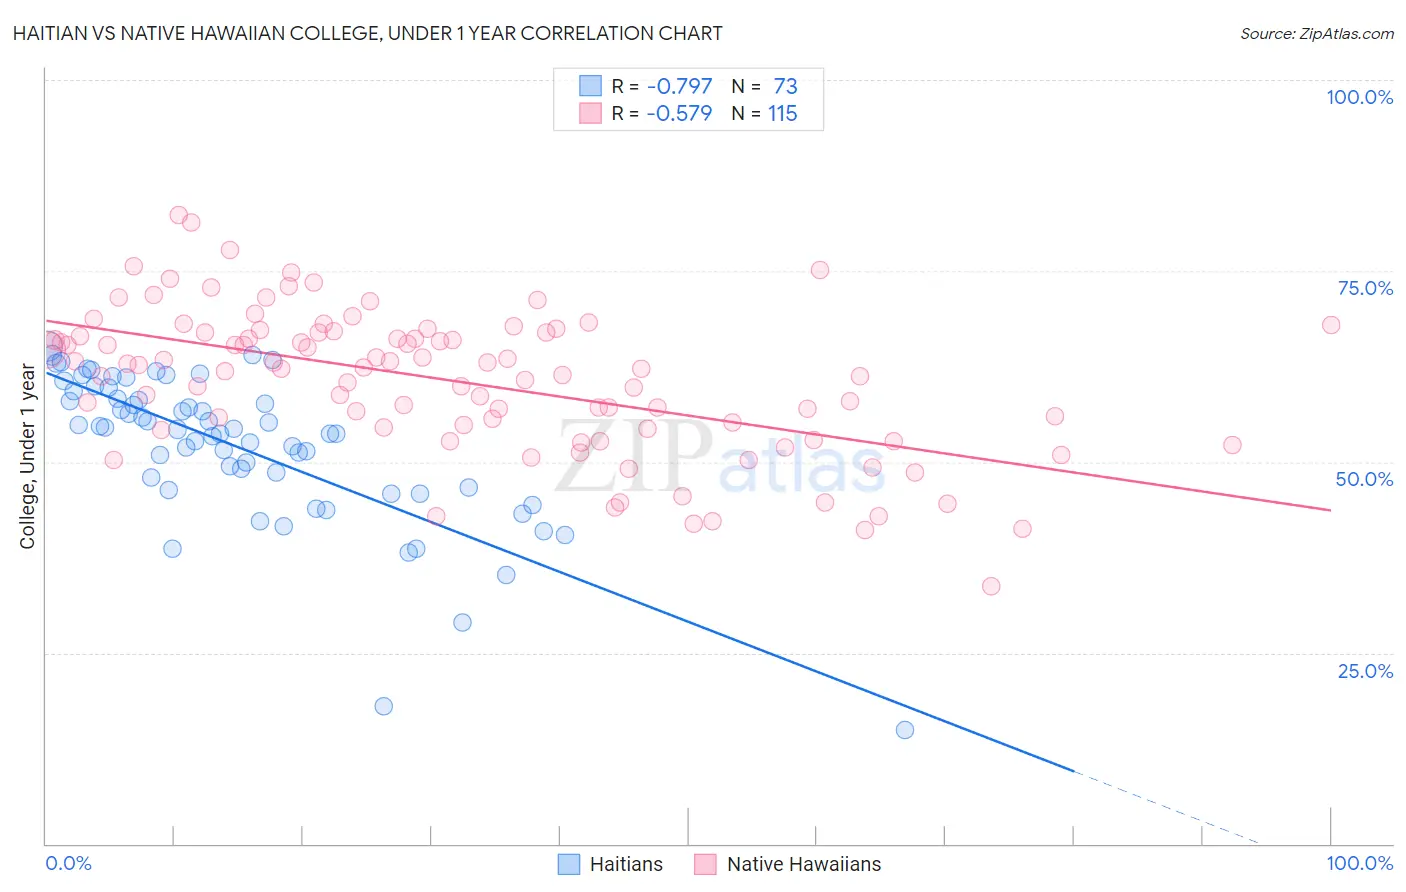
Haitian vs Native Hawaiian College, Under 1 year Correlation Chart
The statistical analysis conducted on geographies consisting of 288,016,617 people shows a strong negative correlation between the proportion of Haitians and percentage of population with at least college, under 1 year education in the United States with a correlation coefficient (R) of -0.797 and weighted average of 57.8%. Similarly, the statistical analysis conducted on geographies consisting of 332,118,930 people shows a substantial negative correlation between the proportion of Native Hawaiians and percentage of population with at least college, under 1 year education in the United States with a correlation coefficient (R) of -0.579 and weighted average of 63.9%, a difference of 10.5%.
College, Under 1 year Correlation Summary
| Measurement | Haitian | Native Hawaiian |
| Minimum | 14.8% | 33.7% |
| Maximum | 65.2% | 82.3% |
| Range | 50.4% | 48.7% |
| Mean | 52.0% | 60.5% |
| Median | 54.3% | 62.2% |
| Interquartile 25% (IQ1) | 46.5% | 54.4% |
| Interquartile 75% (IQ3) | 58.8% | 67.0% |
| Interquartile Range (IQR) | 12.3% | 12.6% |
| Standard Deviation (Sample) | 9.9% | 9.4% |
| Standard Deviation (Population) | 9.8% | 9.4% |
Similar Demographics by College, Under 1 year
Demographics Similar to Haitians by College, Under 1 year
In terms of college, under 1 year, the demographic groups most similar to Haitians are Kiowa (57.8%, a difference of 0.11%), Immigrants from Dominica (57.9%, a difference of 0.12%), Immigrants from Portugal (57.7%, a difference of 0.20%), Fijian (57.7%, a difference of 0.21%), and Central American (57.7%, a difference of 0.21%).
| Demographics | Rating | Rank | College, Under 1 year |
| Immigrants | Ecuador | 0.0 /100 | #298 | Tragic 58.7% |
| Cubans | 0.0 /100 | #299 | Tragic 58.6% |
| Immigrants | Guyana | 0.0 /100 | #300 | Tragic 58.5% |
| Mexican American Indians | 0.0 /100 | #301 | Tragic 58.1% |
| Apache | 0.0 /100 | #302 | Tragic 58.0% |
| Immigrants | Dominica | 0.0 /100 | #303 | Tragic 57.9% |
| Kiowa | 0.0 /100 | #304 | Tragic 57.8% |
| Haitians | 0.0 /100 | #305 | Tragic 57.8% |
| Immigrants | Portugal | 0.0 /100 | #306 | Tragic 57.7% |
| Fijians | 0.0 /100 | #307 | Tragic 57.7% |
| Central Americans | 0.0 /100 | #308 | Tragic 57.7% |
| Immigrants | Nicaragua | 0.0 /100 | #309 | Tragic 57.6% |
| Pueblo | 0.0 /100 | #310 | Tragic 57.4% |
| Cajuns | 0.0 /100 | #311 | Tragic 57.3% |
| Salvadorans | 0.0 /100 | #312 | Tragic 57.3% |
Demographics Similar to Native Hawaiians by College, Under 1 year
In terms of college, under 1 year, the demographic groups most similar to Native Hawaiians are Immigrants from Middle Africa (63.9%, a difference of 0.010%), Ghanaian (63.9%, a difference of 0.070%), Puget Sound Salish (63.9%, a difference of 0.080%), Immigrants from Vietnam (64.0%, a difference of 0.17%), and Immigrants from South America (63.8%, a difference of 0.19%).
| Demographics | Rating | Rank | College, Under 1 year |
| Immigrants | Zaire | 14.6 /100 | #204 | Poor 64.1% |
| Peruvians | 13.7 /100 | #205 | Poor 64.1% |
| Whites/Caucasians | 12.8 /100 | #206 | Poor 64.0% |
| Colombians | 12.4 /100 | #207 | Poor 64.0% |
| Immigrants | Vietnam | 12.1 /100 | #208 | Poor 64.0% |
| Puget Sound Salish | 11.3 /100 | #209 | Poor 63.9% |
| Ghanaians | 11.2 /100 | #210 | Poor 63.9% |
| Native Hawaiians | 10.6 /100 | #211 | Poor 63.9% |
| Immigrants | Middle Africa | 10.5 /100 | #212 | Poor 63.9% |
| Immigrants | South America | 9.1 /100 | #213 | Tragic 63.8% |
| Immigrants | Nigeria | 8.8 /100 | #214 | Tragic 63.7% |
| Senegalese | 7.7 /100 | #215 | Tragic 63.6% |
| Hmong | 6.8 /100 | #216 | Tragic 63.5% |
| Immigrants | Uruguay | 5.8 /100 | #217 | Tragic 63.4% |
| Immigrants | Panama | 5.7 /100 | #218 | Tragic 63.4% |