Haitian vs Polish College, Under 1 year
COMPARE
Haitian
Polish
College, Under 1 year
College, Under 1 year Comparison
Haitians
Poles
57.8%
COLLEGE, UNDER 1 YEAR
0.0/ 100
METRIC RATING
305th/ 347
METRIC RANK
66.9%
COLLEGE, UNDER 1 YEAR
88.4/ 100
METRIC RATING
132nd/ 347
METRIC RANK
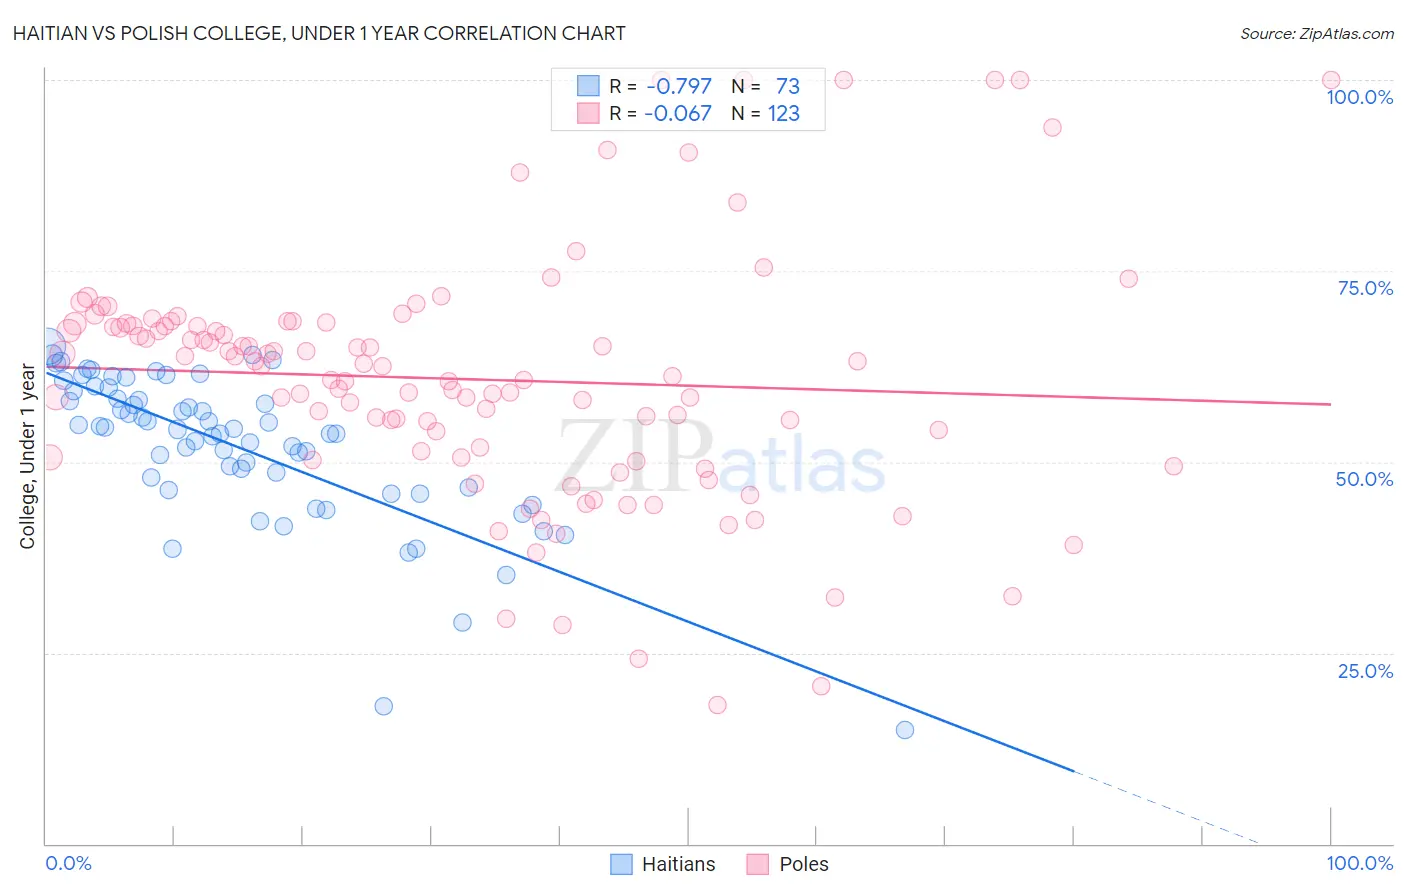
Haitian vs Polish College, Under 1 year Correlation Chart
The statistical analysis conducted on geographies consisting of 288,016,617 people shows a strong negative correlation between the proportion of Haitians and percentage of population with at least college, under 1 year education in the United States with a correlation coefficient (R) of -0.797 and weighted average of 57.8%. Similarly, the statistical analysis conducted on geographies consisting of 560,588,351 people shows a slight negative correlation between the proportion of Poles and percentage of population with at least college, under 1 year education in the United States with a correlation coefficient (R) of -0.067 and weighted average of 66.9%, a difference of 15.7%.
College, Under 1 year Correlation Summary
| Measurement | Haitian | Polish |
| Minimum | 14.8% | 18.2% |
| Maximum | 65.2% | 100.0% |
| Range | 50.4% | 81.8% |
| Mean | 52.0% | 60.8% |
| Median | 54.3% | 62.5% |
| Interquartile 25% (IQ1) | 46.5% | 50.6% |
| Interquartile 75% (IQ3) | 58.8% | 68.1% |
| Interquartile Range (IQR) | 12.3% | 17.4% |
| Standard Deviation (Sample) | 9.9% | 16.0% |
| Standard Deviation (Population) | 9.8% | 15.9% |
Similar Demographics by College, Under 1 year
Demographics Similar to Haitians by College, Under 1 year
In terms of college, under 1 year, the demographic groups most similar to Haitians are Kiowa (57.8%, a difference of 0.11%), Immigrants from Dominica (57.9%, a difference of 0.12%), Immigrants from Portugal (57.7%, a difference of 0.20%), Fijian (57.7%, a difference of 0.21%), and Central American (57.7%, a difference of 0.21%).
| Demographics | Rating | Rank | College, Under 1 year |
| Immigrants | Ecuador | 0.0 /100 | #298 | Tragic 58.7% |
| Cubans | 0.0 /100 | #299 | Tragic 58.6% |
| Immigrants | Guyana | 0.0 /100 | #300 | Tragic 58.5% |
| Mexican American Indians | 0.0 /100 | #301 | Tragic 58.1% |
| Apache | 0.0 /100 | #302 | Tragic 58.0% |
| Immigrants | Dominica | 0.0 /100 | #303 | Tragic 57.9% |
| Kiowa | 0.0 /100 | #304 | Tragic 57.8% |
| Haitians | 0.0 /100 | #305 | Tragic 57.8% |
| Immigrants | Portugal | 0.0 /100 | #306 | Tragic 57.7% |
| Fijians | 0.0 /100 | #307 | Tragic 57.7% |
| Central Americans | 0.0 /100 | #308 | Tragic 57.7% |
| Immigrants | Nicaragua | 0.0 /100 | #309 | Tragic 57.6% |
| Pueblo | 0.0 /100 | #310 | Tragic 57.4% |
| Cajuns | 0.0 /100 | #311 | Tragic 57.3% |
| Salvadorans | 0.0 /100 | #312 | Tragic 57.3% |
Demographics Similar to Poles by College, Under 1 year
In terms of college, under 1 year, the demographic groups most similar to Poles are Immigrants from Brazil (66.9%, a difference of 0.010%), Finnish (66.9%, a difference of 0.020%), Iraqi (66.8%, a difference of 0.050%), Immigrants from Syria (66.9%, a difference of 0.060%), and Canadian (66.8%, a difference of 0.060%).
| Demographics | Rating | Rank | College, Under 1 year |
| Italians | 91.8 /100 | #125 | Exceptional 67.2% |
| Alsatians | 91.3 /100 | #126 | Exceptional 67.1% |
| Czechs | 90.8 /100 | #127 | Exceptional 67.1% |
| Scottish | 90.2 /100 | #128 | Exceptional 67.0% |
| Immigrants | Eastern Africa | 89.5 /100 | #129 | Excellent 67.0% |
| Immigrants | Syria | 89.0 /100 | #130 | Excellent 66.9% |
| Finns | 88.6 /100 | #131 | Excellent 66.9% |
| Poles | 88.4 /100 | #132 | Excellent 66.9% |
| Immigrants | Brazil | 88.3 /100 | #133 | Excellent 66.9% |
| Iraqis | 88.0 /100 | #134 | Excellent 66.8% |
| Canadians | 87.9 /100 | #135 | Excellent 66.8% |
| Ugandans | 87.8 /100 | #136 | Excellent 66.8% |
| Immigrants | Chile | 87.4 /100 | #137 | Excellent 66.8% |
| Immigrants | Italy | 86.9 /100 | #138 | Excellent 66.8% |
| Venezuelans | 85.9 /100 | #139 | Excellent 66.7% |