Haitian vs Barbadian College, Under 1 year
COMPARE
Haitian
Barbadian
College, Under 1 year
College, Under 1 year Comparison
Haitians
Barbadians
57.8%
COLLEGE, UNDER 1 YEAR
0.0/ 100
METRIC RATING
305th/ 347
METRIC RANK
61.1%
COLLEGE, UNDER 1 YEAR
0.2/ 100
METRIC RATING
262nd/ 347
METRIC RANK
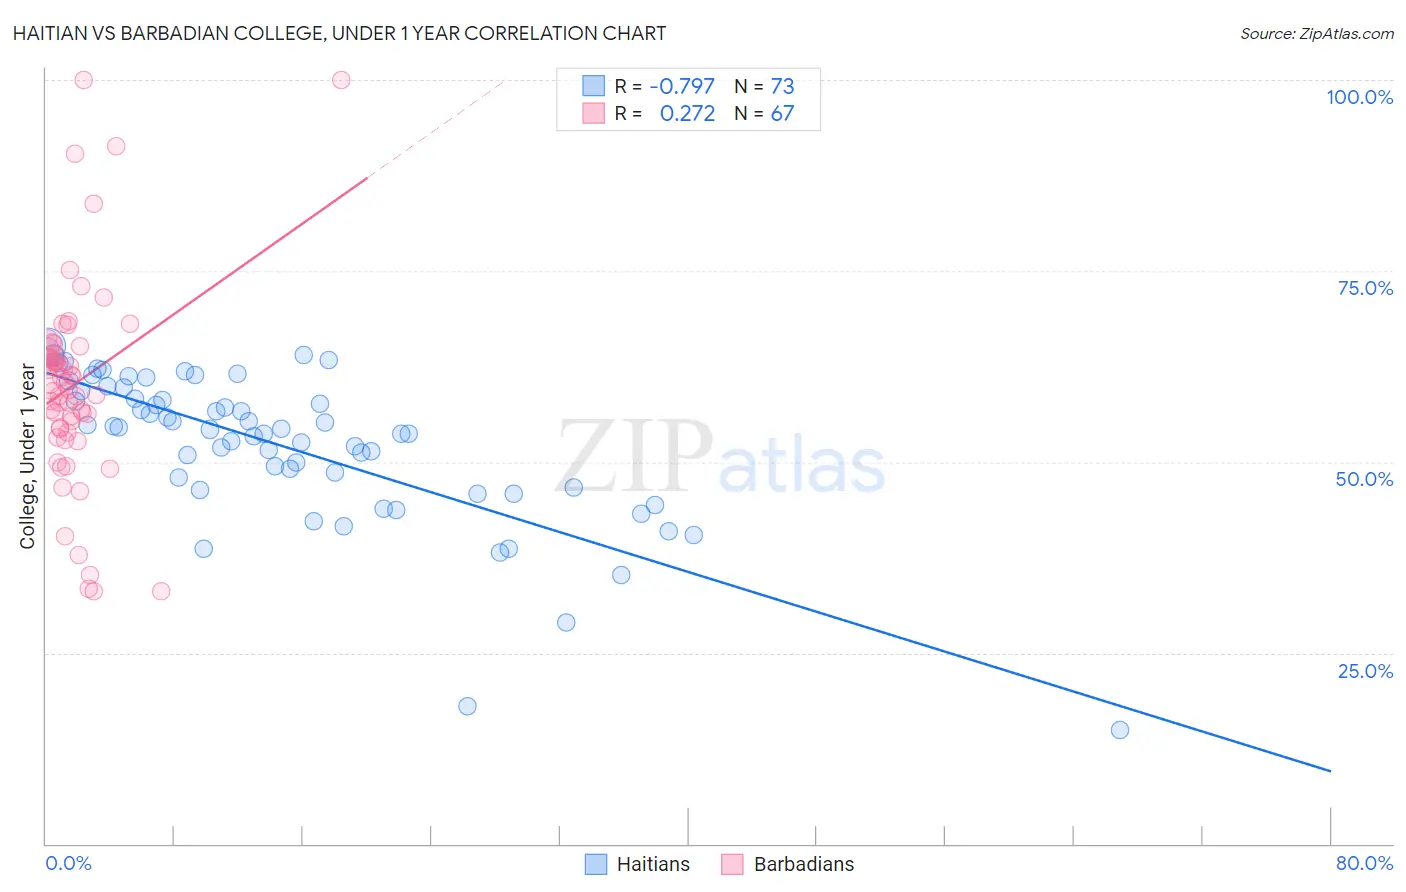
Haitian vs Barbadian College, Under 1 year Correlation Chart
The statistical analysis conducted on geographies consisting of 288,016,617 people shows a strong negative correlation between the proportion of Haitians and percentage of population with at least college, under 1 year education in the United States with a correlation coefficient (R) of -0.797 and weighted average of 57.8%. Similarly, the statistical analysis conducted on geographies consisting of 141,304,590 people shows a weak positive correlation between the proportion of Barbadians and percentage of population with at least college, under 1 year education in the United States with a correlation coefficient (R) of 0.272 and weighted average of 61.1%, a difference of 5.7%.
College, Under 1 year Correlation Summary
| Measurement | Haitian | Barbadian |
| Minimum | 14.8% | 33.0% |
| Maximum | 65.2% | 100.0% |
| Range | 50.4% | 67.0% |
| Mean | 52.0% | 60.2% |
| Median | 54.3% | 60.2% |
| Interquartile 25% (IQ1) | 46.5% | 54.4% |
| Interquartile 75% (IQ3) | 58.8% | 64.7% |
| Interquartile Range (IQR) | 12.3% | 10.3% |
| Standard Deviation (Sample) | 9.9% | 13.2% |
| Standard Deviation (Population) | 9.8% | 13.1% |
Similar Demographics by College, Under 1 year
Demographics Similar to Haitians by College, Under 1 year
In terms of college, under 1 year, the demographic groups most similar to Haitians are Kiowa (57.8%, a difference of 0.11%), Immigrants from Dominica (57.9%, a difference of 0.12%), Immigrants from Portugal (57.7%, a difference of 0.20%), Fijian (57.7%, a difference of 0.21%), and Central American (57.7%, a difference of 0.21%).
| Demographics | Rating | Rank | College, Under 1 year |
| Immigrants | Ecuador | 0.0 /100 | #298 | Tragic 58.7% |
| Cubans | 0.0 /100 | #299 | Tragic 58.6% |
| Immigrants | Guyana | 0.0 /100 | #300 | Tragic 58.5% |
| Mexican American Indians | 0.0 /100 | #301 | Tragic 58.1% |
| Apache | 0.0 /100 | #302 | Tragic 58.0% |
| Immigrants | Dominica | 0.0 /100 | #303 | Tragic 57.9% |
| Kiowa | 0.0 /100 | #304 | Tragic 57.8% |
| Haitians | 0.0 /100 | #305 | Tragic 57.8% |
| Immigrants | Portugal | 0.0 /100 | #306 | Tragic 57.7% |
| Fijians | 0.0 /100 | #307 | Tragic 57.7% |
| Central Americans | 0.0 /100 | #308 | Tragic 57.7% |
| Immigrants | Nicaragua | 0.0 /100 | #309 | Tragic 57.6% |
| Pueblo | 0.0 /100 | #310 | Tragic 57.4% |
| Cajuns | 0.0 /100 | #311 | Tragic 57.3% |
| Salvadorans | 0.0 /100 | #312 | Tragic 57.3% |
Demographics Similar to Barbadians by College, Under 1 year
In terms of college, under 1 year, the demographic groups most similar to Barbadians are Shoshone (61.1%, a difference of 0.010%), African (61.1%, a difference of 0.040%), Blackfeet (61.1%, a difference of 0.070%), Trinidadian and Tobagonian (61.1%, a difference of 0.070%), and Immigrants from Bahamas (61.1%, a difference of 0.070%).
| Demographics | Rating | Rank | College, Under 1 year |
| Comanche | 0.4 /100 | #255 | Tragic 61.4% |
| Bangladeshis | 0.4 /100 | #256 | Tragic 61.4% |
| Immigrants | Laos | 0.3 /100 | #257 | Tragic 61.3% |
| Immigrants | Bangladesh | 0.3 /100 | #258 | Tragic 61.3% |
| Indonesians | 0.3 /100 | #259 | Tragic 61.2% |
| Blackfeet | 0.3 /100 | #260 | Tragic 61.1% |
| Africans | 0.3 /100 | #261 | Tragic 61.1% |
| Barbadians | 0.2 /100 | #262 | Tragic 61.1% |
| Shoshone | 0.2 /100 | #263 | Tragic 61.1% |
| Trinidadians and Tobagonians | 0.2 /100 | #264 | Tragic 61.1% |
| Immigrants | Bahamas | 0.2 /100 | #265 | Tragic 61.1% |
| Alaskan Athabascans | 0.2 /100 | #266 | Tragic 61.0% |
| Americans | 0.2 /100 | #267 | Tragic 61.0% |
| Immigrants | Trinidad and Tobago | 0.1 /100 | #268 | Tragic 60.7% |
| Immigrants | West Indies | 0.1 /100 | #269 | Tragic 60.6% |