Haitian vs Immigrants from Colombia College, Under 1 year
COMPARE
Haitian
Immigrants from Colombia
College, Under 1 year
College, Under 1 year Comparison
Haitians
Immigrants from Colombia
57.8%
COLLEGE, UNDER 1 YEAR
0.0/ 100
METRIC RATING
305th/ 347
METRIC RANK
63.1%
COLLEGE, UNDER 1 YEAR
4.0/ 100
METRIC RATING
226th/ 347
METRIC RANK
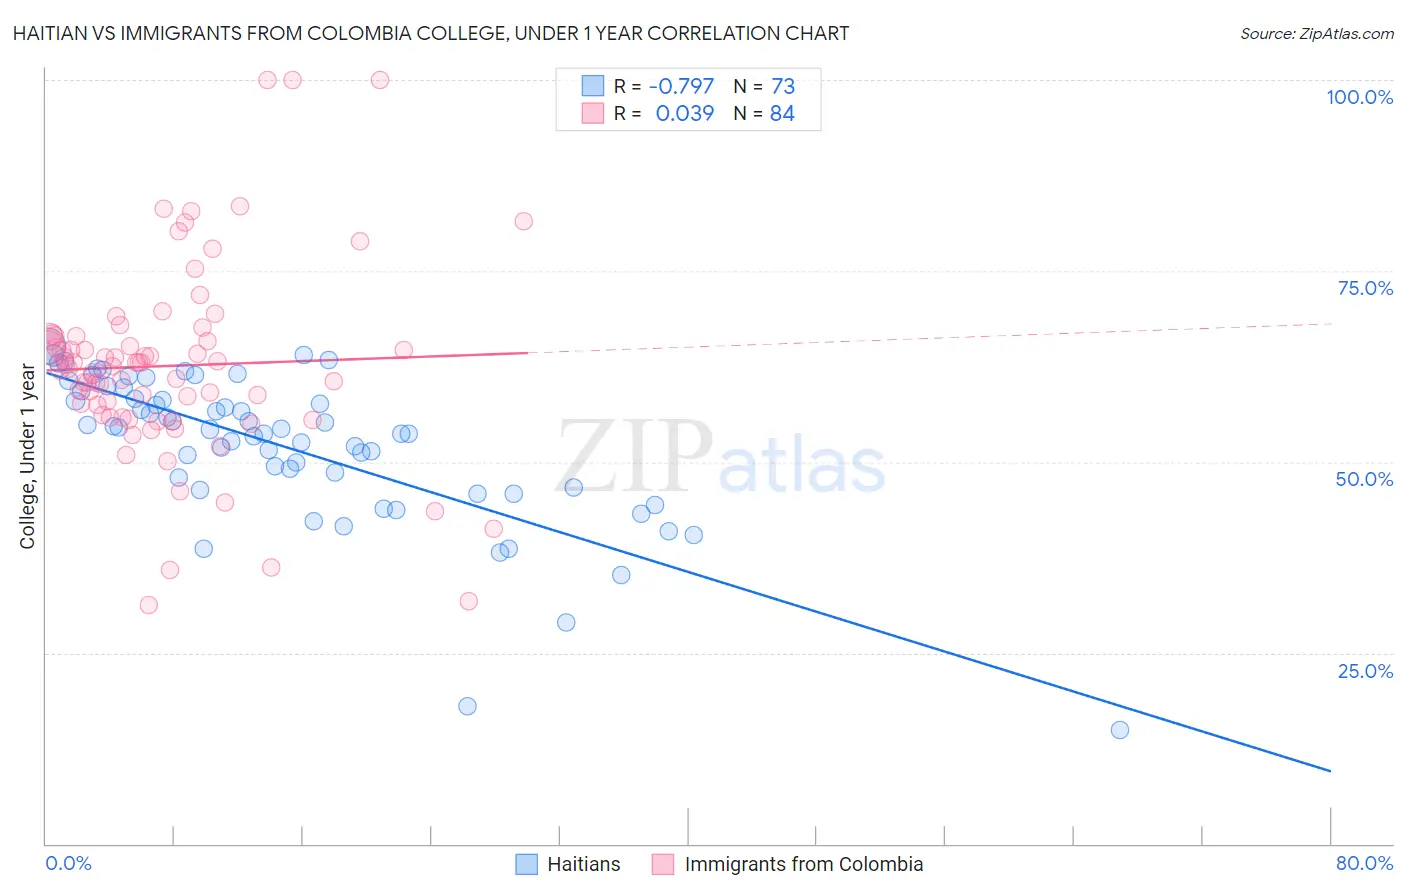
Haitian vs Immigrants from Colombia College, Under 1 year Correlation Chart
The statistical analysis conducted on geographies consisting of 288,016,617 people shows a strong negative correlation between the proportion of Haitians and percentage of population with at least college, under 1 year education in the United States with a correlation coefficient (R) of -0.797 and weighted average of 57.8%. Similarly, the statistical analysis conducted on geographies consisting of 378,689,260 people shows no correlation between the proportion of Immigrants from Colombia and percentage of population with at least college, under 1 year education in the United States with a correlation coefficient (R) of 0.039 and weighted average of 63.1%, a difference of 9.2%.
College, Under 1 year Correlation Summary
| Measurement | Haitian | Immigrants from Colombia |
| Minimum | 14.8% | 31.3% |
| Maximum | 65.2% | 100.0% |
| Range | 50.4% | 68.7% |
| Mean | 52.0% | 62.6% |
| Median | 54.3% | 62.6% |
| Interquartile 25% (IQ1) | 46.5% | 56.0% |
| Interquartile 75% (IQ3) | 58.8% | 66.5% |
| Interquartile Range (IQR) | 12.3% | 10.4% |
| Standard Deviation (Sample) | 9.9% | 12.8% |
| Standard Deviation (Population) | 9.8% | 12.7% |
Similar Demographics by College, Under 1 year
Demographics Similar to Haitians by College, Under 1 year
In terms of college, under 1 year, the demographic groups most similar to Haitians are Kiowa (57.8%, a difference of 0.11%), Immigrants from Dominica (57.9%, a difference of 0.12%), Immigrants from Portugal (57.7%, a difference of 0.20%), Fijian (57.7%, a difference of 0.21%), and Central American (57.7%, a difference of 0.21%).
| Demographics | Rating | Rank | College, Under 1 year |
| Immigrants | Ecuador | 0.0 /100 | #298 | Tragic 58.7% |
| Cubans | 0.0 /100 | #299 | Tragic 58.6% |
| Immigrants | Guyana | 0.0 /100 | #300 | Tragic 58.5% |
| Mexican American Indians | 0.0 /100 | #301 | Tragic 58.1% |
| Apache | 0.0 /100 | #302 | Tragic 58.0% |
| Immigrants | Dominica | 0.0 /100 | #303 | Tragic 57.9% |
| Kiowa | 0.0 /100 | #304 | Tragic 57.8% |
| Haitians | 0.0 /100 | #305 | Tragic 57.8% |
| Immigrants | Portugal | 0.0 /100 | #306 | Tragic 57.7% |
| Fijians | 0.0 /100 | #307 | Tragic 57.7% |
| Central Americans | 0.0 /100 | #308 | Tragic 57.7% |
| Immigrants | Nicaragua | 0.0 /100 | #309 | Tragic 57.6% |
| Pueblo | 0.0 /100 | #310 | Tragic 57.4% |
| Cajuns | 0.0 /100 | #311 | Tragic 57.3% |
| Salvadorans | 0.0 /100 | #312 | Tragic 57.3% |
Demographics Similar to Immigrants from Colombia by College, Under 1 year
In terms of college, under 1 year, the demographic groups most similar to Immigrants from Colombia are Immigrants from Peru (63.1%, a difference of 0.020%), Immigrants from Ghana (63.1%, a difference of 0.090%), Subsaharan African (63.2%, a difference of 0.12%), Immigrants from Costa Rica (63.2%, a difference of 0.15%), and Samoan (63.0%, a difference of 0.20%).
| Demographics | Rating | Rank | College, Under 1 year |
| Immigrants | Fiji | 5.7 /100 | #219 | Tragic 63.4% |
| Portuguese | 5.6 /100 | #220 | Tragic 63.4% |
| Cree | 5.2 /100 | #221 | Tragic 63.3% |
| Immigrants | Senegal | 5.0 /100 | #222 | Tragic 63.3% |
| Immigrants | Costa Rica | 4.5 /100 | #223 | Tragic 63.2% |
| Sub-Saharan Africans | 4.4 /100 | #224 | Tragic 63.2% |
| Immigrants | Peru | 4.0 /100 | #225 | Tragic 63.1% |
| Immigrants | Colombia | 4.0 /100 | #226 | Tragic 63.1% |
| Immigrants | Ghana | 3.7 /100 | #227 | Tragic 63.1% |
| Samoans | 3.3 /100 | #228 | Tragic 63.0% |
| Liberians | 3.2 /100 | #229 | Tragic 63.0% |
| Immigrants | Nonimmigrants | 3.0 /100 | #230 | Tragic 62.9% |
| Immigrants | Western Africa | 2.4 /100 | #231 | Tragic 62.8% |
| Osage | 2.2 /100 | #232 | Tragic 62.7% |
| Iroquois | 2.0 /100 | #233 | Tragic 62.6% |