Cape Verdean vs Cheyenne College, Under 1 year
COMPARE
Cape Verdean
Cheyenne
College, Under 1 year
College, Under 1 year Comparison
Cape Verdeans
Cheyenne
56.0%
COLLEGE, UNDER 1 YEAR
0.0/ 100
METRIC RATING
328th/ 347
METRIC RANK
60.6%
COLLEGE, UNDER 1 YEAR
0.1/ 100
METRIC RATING
270th/ 347
METRIC RANK
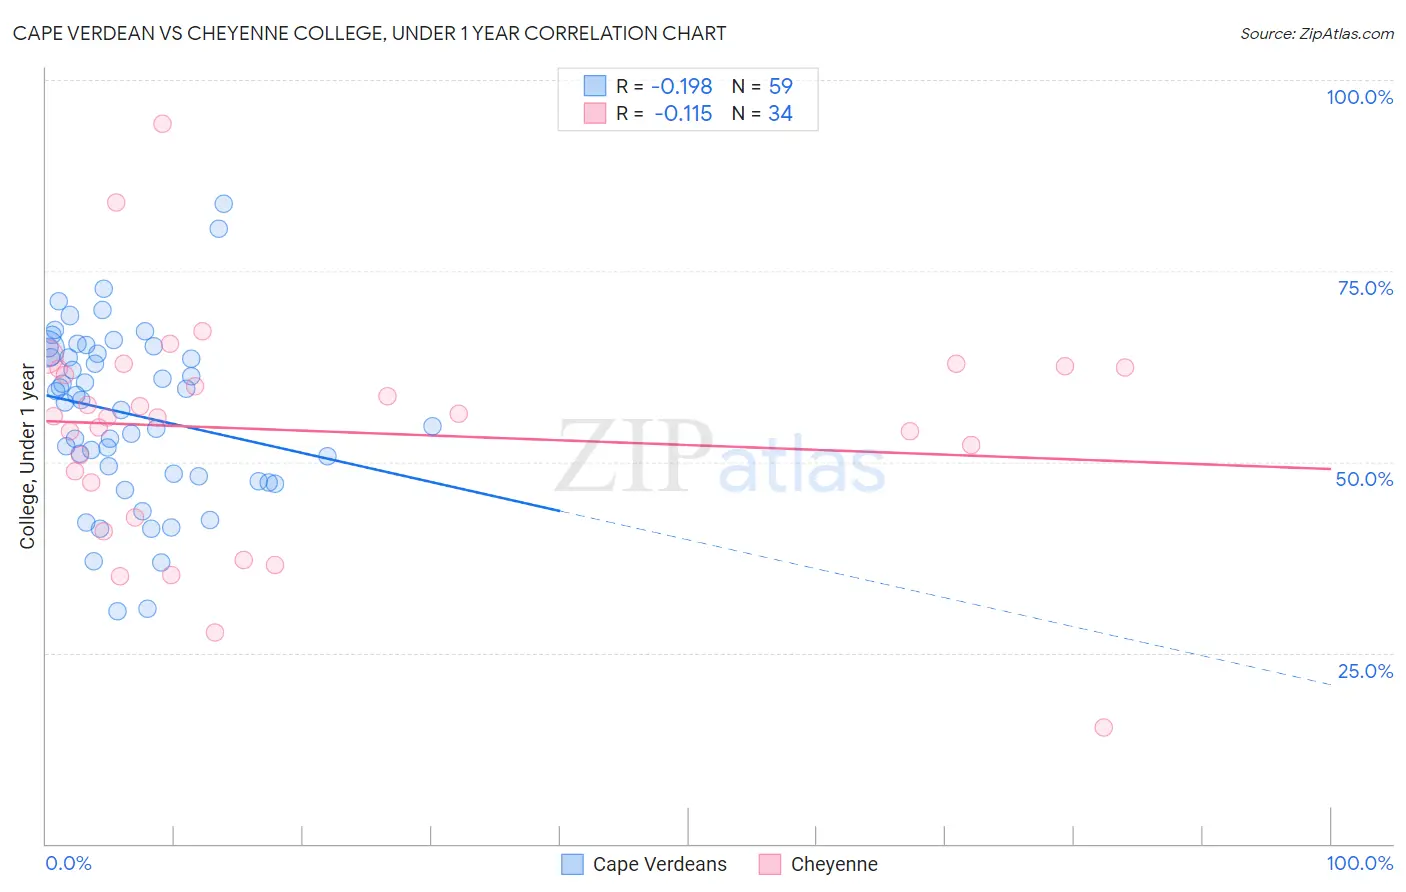
Cape Verdean vs Cheyenne College, Under 1 year Correlation Chart
The statistical analysis conducted on geographies consisting of 107,580,652 people shows a poor negative correlation between the proportion of Cape Verdeans and percentage of population with at least college, under 1 year education in the United States with a correlation coefficient (R) of -0.198 and weighted average of 56.0%. Similarly, the statistical analysis conducted on geographies consisting of 80,719,411 people shows a poor negative correlation between the proportion of Cheyenne and percentage of population with at least college, under 1 year education in the United States with a correlation coefficient (R) of -0.115 and weighted average of 60.6%, a difference of 8.1%.
College, Under 1 year Correlation Summary
| Measurement | Cape Verdean | Cheyenne |
| Minimum | 30.4% | 15.3% |
| Maximum | 83.7% | 94.3% |
| Range | 53.4% | 79.1% |
| Mean | 56.3% | 54.1% |
| Median | 58.0% | 55.9% |
| Interquartile 25% (IQ1) | 48.2% | 47.3% |
| Interquartile 75% (IQ3) | 64.8% | 62.4% |
| Interquartile Range (IQR) | 16.6% | 15.0% |
| Standard Deviation (Sample) | 11.3% | 14.9% |
| Standard Deviation (Population) | 11.2% | 14.7% |
Similar Demographics by College, Under 1 year
Demographics Similar to Cape Verdeans by College, Under 1 year
In terms of college, under 1 year, the demographic groups most similar to Cape Verdeans are Immigrants from Guatemala (56.2%, a difference of 0.29%), Navajo (56.3%, a difference of 0.38%), Immigrants from Latin America (56.3%, a difference of 0.53%), Immigrants from Cuba (55.7%, a difference of 0.62%), and Immigrants from El Salvador (56.4%, a difference of 0.63%).
| Demographics | Rating | Rank | College, Under 1 year |
| Natives/Alaskans | 0.0 /100 | #321 | Tragic 56.6% |
| Immigrants | Caribbean | 0.0 /100 | #322 | Tragic 56.6% |
| Immigrants | Honduras | 0.0 /100 | #323 | Tragic 56.5% |
| Immigrants | El Salvador | 0.0 /100 | #324 | Tragic 56.4% |
| Immigrants | Latin America | 0.0 /100 | #325 | Tragic 56.3% |
| Navajo | 0.0 /100 | #326 | Tragic 56.3% |
| Immigrants | Guatemala | 0.0 /100 | #327 | Tragic 56.2% |
| Cape Verdeans | 0.0 /100 | #328 | Tragic 56.0% |
| Immigrants | Cuba | 0.0 /100 | #329 | Tragic 55.7% |
| Mexicans | 0.0 /100 | #330 | Tragic 55.6% |
| Dominicans | 0.0 /100 | #331 | Tragic 55.5% |
| Immigrants | Yemen | 0.0 /100 | #332 | Tragic 55.3% |
| Yuman | 0.0 /100 | #333 | Tragic 55.1% |
| Immigrants | Azores | 0.0 /100 | #334 | Tragic 54.7% |
| Inupiat | 0.0 /100 | #335 | Tragic 54.6% |
Demographics Similar to Cheyenne by College, Under 1 year
In terms of college, under 1 year, the demographic groups most similar to Cheyenne are U.S. Virgin Islander (60.6%, a difference of 0.020%), Immigrants from West Indies (60.6%, a difference of 0.11%), Jamaican (60.5%, a difference of 0.17%), Chickasaw (60.4%, a difference of 0.22%), and Alaska Native (60.4%, a difference of 0.22%).
| Demographics | Rating | Rank | College, Under 1 year |
| Shoshone | 0.2 /100 | #263 | Tragic 61.1% |
| Trinidadians and Tobagonians | 0.2 /100 | #264 | Tragic 61.1% |
| Immigrants | Bahamas | 0.2 /100 | #265 | Tragic 61.1% |
| Alaskan Athabascans | 0.2 /100 | #266 | Tragic 61.0% |
| Americans | 0.2 /100 | #267 | Tragic 61.0% |
| Immigrants | Trinidad and Tobago | 0.1 /100 | #268 | Tragic 60.7% |
| Immigrants | West Indies | 0.1 /100 | #269 | Tragic 60.6% |
| Cheyenne | 0.1 /100 | #270 | Tragic 60.6% |
| U.S. Virgin Islanders | 0.1 /100 | #271 | Tragic 60.6% |
| Jamaicans | 0.1 /100 | #272 | Tragic 60.5% |
| Chickasaw | 0.1 /100 | #273 | Tragic 60.4% |
| Alaska Natives | 0.1 /100 | #274 | Tragic 60.4% |
| Immigrants | Barbados | 0.1 /100 | #275 | Tragic 60.4% |
| Arapaho | 0.1 /100 | #276 | Tragic 60.3% |
| Bahamians | 0.1 /100 | #277 | Tragic 60.3% |