Cape Verdean vs Soviet Union College, Under 1 year
COMPARE
Cape Verdean
Soviet Union
College, Under 1 year
College, Under 1 year Comparison
Cape Verdeans
Soviet Union
56.0%
COLLEGE, UNDER 1 YEAR
0.0/ 100
METRIC RATING
328th/ 347
METRIC RANK
71.1%
COLLEGE, UNDER 1 YEAR
100.0/ 100
METRIC RATING
24th/ 347
METRIC RANK
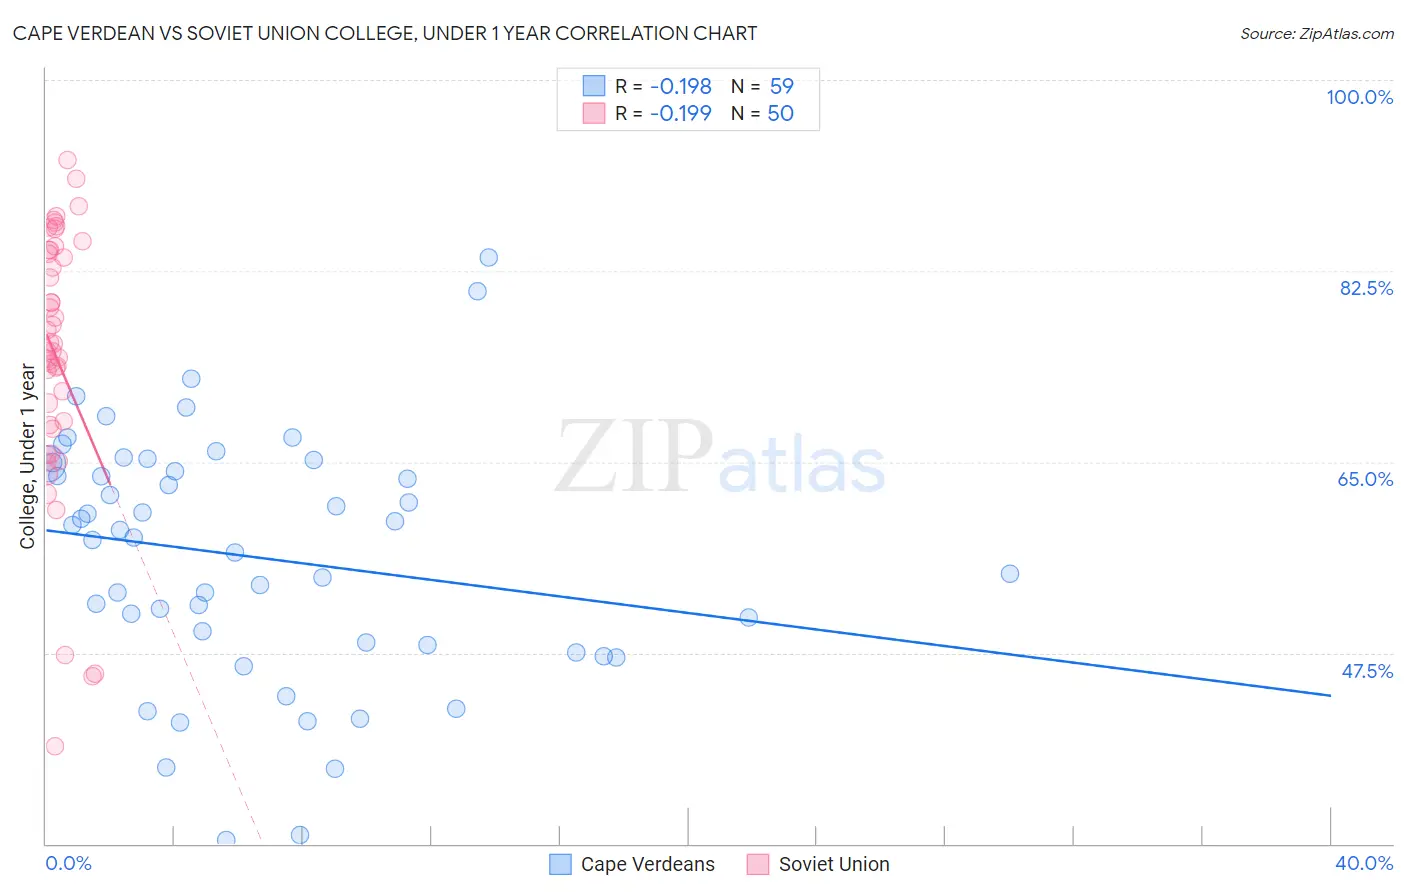
Cape Verdean vs Soviet Union College, Under 1 year Correlation Chart
The statistical analysis conducted on geographies consisting of 107,580,652 people shows a poor negative correlation between the proportion of Cape Verdeans and percentage of population with at least college, under 1 year education in the United States with a correlation coefficient (R) of -0.198 and weighted average of 56.0%. Similarly, the statistical analysis conducted on geographies consisting of 43,514,626 people shows a poor negative correlation between the proportion of Soviet Union and percentage of population with at least college, under 1 year education in the United States with a correlation coefficient (R) of -0.199 and weighted average of 71.1%, a difference of 26.9%.
College, Under 1 year Correlation Summary
| Measurement | Cape Verdean | Soviet Union |
| Minimum | 30.4% | 39.0% |
| Maximum | 83.7% | 92.7% |
| Range | 53.4% | 53.7% |
| Mean | 56.3% | 74.6% |
| Median | 58.0% | 75.5% |
| Interquartile 25% (IQ1) | 48.2% | 68.4% |
| Interquartile 75% (IQ3) | 64.8% | 84.4% |
| Interquartile Range (IQR) | 16.6% | 16.0% |
| Standard Deviation (Sample) | 11.3% | 12.1% |
| Standard Deviation (Population) | 11.2% | 12.0% |
Similar Demographics by College, Under 1 year
Demographics Similar to Cape Verdeans by College, Under 1 year
In terms of college, under 1 year, the demographic groups most similar to Cape Verdeans are Immigrants from Guatemala (56.2%, a difference of 0.29%), Navajo (56.3%, a difference of 0.38%), Immigrants from Latin America (56.3%, a difference of 0.53%), Immigrants from Cuba (55.7%, a difference of 0.62%), and Immigrants from El Salvador (56.4%, a difference of 0.63%).
| Demographics | Rating | Rank | College, Under 1 year |
| Natives/Alaskans | 0.0 /100 | #321 | Tragic 56.6% |
| Immigrants | Caribbean | 0.0 /100 | #322 | Tragic 56.6% |
| Immigrants | Honduras | 0.0 /100 | #323 | Tragic 56.5% |
| Immigrants | El Salvador | 0.0 /100 | #324 | Tragic 56.4% |
| Immigrants | Latin America | 0.0 /100 | #325 | Tragic 56.3% |
| Navajo | 0.0 /100 | #326 | Tragic 56.3% |
| Immigrants | Guatemala | 0.0 /100 | #327 | Tragic 56.2% |
| Cape Verdeans | 0.0 /100 | #328 | Tragic 56.0% |
| Immigrants | Cuba | 0.0 /100 | #329 | Tragic 55.7% |
| Mexicans | 0.0 /100 | #330 | Tragic 55.6% |
| Dominicans | 0.0 /100 | #331 | Tragic 55.5% |
| Immigrants | Yemen | 0.0 /100 | #332 | Tragic 55.3% |
| Yuman | 0.0 /100 | #333 | Tragic 55.1% |
| Immigrants | Azores | 0.0 /100 | #334 | Tragic 54.7% |
| Inupiat | 0.0 /100 | #335 | Tragic 54.6% |
Demographics Similar to Soviet Union by College, Under 1 year
In terms of college, under 1 year, the demographic groups most similar to Soviet Union are Immigrants from Northern Europe (71.1%, a difference of 0.010%), Bulgarian (71.1%, a difference of 0.020%), Immigrants from Denmark (71.0%, a difference of 0.13%), Immigrants from Ireland (71.0%, a difference of 0.14%), and Immigrants from Hong Kong (71.0%, a difference of 0.17%).
| Demographics | Rating | Rank | College, Under 1 year |
| Eastern Europeans | 100.0 /100 | #17 | Exceptional 71.8% |
| Immigrants | Switzerland | 100.0 /100 | #18 | Exceptional 71.7% |
| Latvians | 100.0 /100 | #19 | Exceptional 71.6% |
| Immigrants | Korea | 100.0 /100 | #20 | Exceptional 71.6% |
| Immigrants | Belgium | 100.0 /100 | #21 | Exceptional 71.5% |
| Immigrants | Eastern Asia | 100.0 /100 | #22 | Exceptional 71.3% |
| Immigrants | Northern Europe | 100.0 /100 | #23 | Exceptional 71.1% |
| Soviet Union | 100.0 /100 | #24 | Exceptional 71.1% |
| Bulgarians | 100.0 /100 | #25 | Exceptional 71.1% |
| Immigrants | Denmark | 100.0 /100 | #26 | Exceptional 71.0% |
| Immigrants | Ireland | 100.0 /100 | #27 | Exceptional 71.0% |
| Immigrants | Hong Kong | 100.0 /100 | #28 | Exceptional 71.0% |
| Immigrants | France | 100.0 /100 | #29 | Exceptional 71.0% |
| Immigrants | China | 99.9 /100 | #30 | Exceptional 70.9% |
| Indians (Asian) | 99.9 /100 | #31 | Exceptional 70.8% |