Cape Verdean vs Immigrants from Russia College, Under 1 year
COMPARE
Cape Verdean
Immigrants from Russia
College, Under 1 year
College, Under 1 year Comparison
Cape Verdeans
Immigrants from Russia
56.0%
COLLEGE, UNDER 1 YEAR
0.0/ 100
METRIC RATING
328th/ 347
METRIC RANK
69.9%
COLLEGE, UNDER 1 YEAR
99.8/ 100
METRIC RATING
52nd/ 347
METRIC RANK
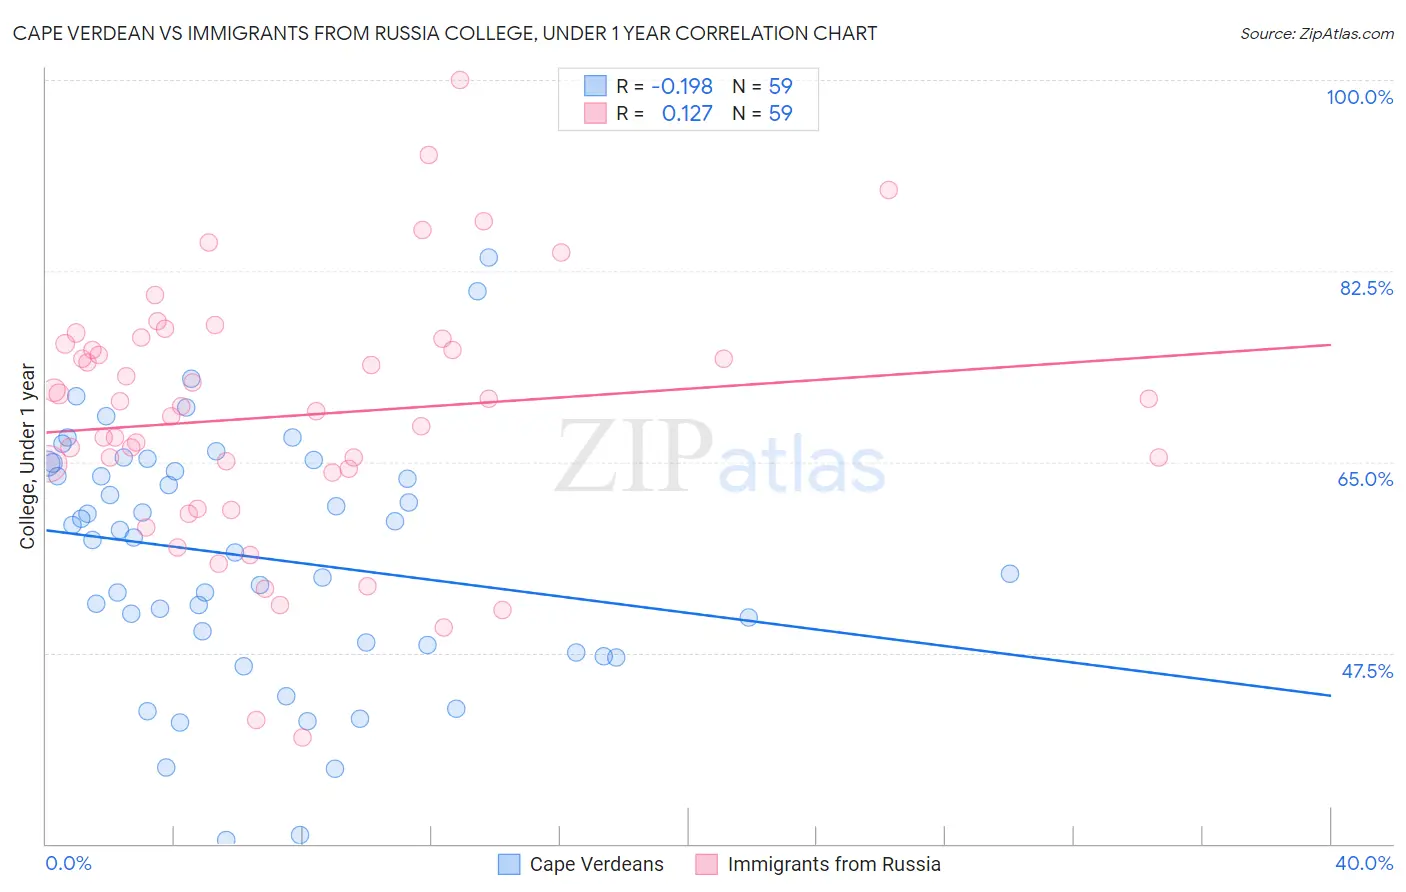
Cape Verdean vs Immigrants from Russia College, Under 1 year Correlation Chart
The statistical analysis conducted on geographies consisting of 107,580,652 people shows a poor negative correlation between the proportion of Cape Verdeans and percentage of population with at least college, under 1 year education in the United States with a correlation coefficient (R) of -0.198 and weighted average of 56.0%. Similarly, the statistical analysis conducted on geographies consisting of 347,947,137 people shows a poor positive correlation between the proportion of Immigrants from Russia and percentage of population with at least college, under 1 year education in the United States with a correlation coefficient (R) of 0.127 and weighted average of 69.9%, a difference of 24.6%.
College, Under 1 year Correlation Summary
| Measurement | Cape Verdean | Immigrants from Russia |
| Minimum | 30.4% | 39.8% |
| Maximum | 83.7% | 100.0% |
| Range | 53.4% | 60.2% |
| Mean | 56.3% | 69.2% |
| Median | 58.0% | 70.1% |
| Interquartile 25% (IQ1) | 48.2% | 64.1% |
| Interquartile 75% (IQ3) | 64.8% | 75.8% |
| Interquartile Range (IQR) | 16.6% | 11.8% |
| Standard Deviation (Sample) | 11.3% | 11.7% |
| Standard Deviation (Population) | 11.2% | 11.6% |
Similar Demographics by College, Under 1 year
Demographics Similar to Cape Verdeans by College, Under 1 year
In terms of college, under 1 year, the demographic groups most similar to Cape Verdeans are Immigrants from Guatemala (56.2%, a difference of 0.29%), Navajo (56.3%, a difference of 0.38%), Immigrants from Latin America (56.3%, a difference of 0.53%), Immigrants from Cuba (55.7%, a difference of 0.62%), and Immigrants from El Salvador (56.4%, a difference of 0.63%).
| Demographics | Rating | Rank | College, Under 1 year |
| Natives/Alaskans | 0.0 /100 | #321 | Tragic 56.6% |
| Immigrants | Caribbean | 0.0 /100 | #322 | Tragic 56.6% |
| Immigrants | Honduras | 0.0 /100 | #323 | Tragic 56.5% |
| Immigrants | El Salvador | 0.0 /100 | #324 | Tragic 56.4% |
| Immigrants | Latin America | 0.0 /100 | #325 | Tragic 56.3% |
| Navajo | 0.0 /100 | #326 | Tragic 56.3% |
| Immigrants | Guatemala | 0.0 /100 | #327 | Tragic 56.2% |
| Cape Verdeans | 0.0 /100 | #328 | Tragic 56.0% |
| Immigrants | Cuba | 0.0 /100 | #329 | Tragic 55.7% |
| Mexicans | 0.0 /100 | #330 | Tragic 55.6% |
| Dominicans | 0.0 /100 | #331 | Tragic 55.5% |
| Immigrants | Yemen | 0.0 /100 | #332 | Tragic 55.3% |
| Yuman | 0.0 /100 | #333 | Tragic 55.1% |
| Immigrants | Azores | 0.0 /100 | #334 | Tragic 54.7% |
| Inupiat | 0.0 /100 | #335 | Tragic 54.6% |
Demographics Similar to Immigrants from Russia by College, Under 1 year
In terms of college, under 1 year, the demographic groups most similar to Immigrants from Russia are Mongolian (69.9%, a difference of 0.020%), Zimbabwean (69.9%, a difference of 0.060%), Immigrants from Austria (70.0%, a difference of 0.18%), Immigrants from Netherlands (70.0%, a difference of 0.22%), and South African (69.7%, a difference of 0.27%).
| Demographics | Rating | Rank | College, Under 1 year |
| Immigrants | Norway | 99.9 /100 | #45 | Exceptional 70.2% |
| Immigrants | Latvia | 99.9 /100 | #46 | Exceptional 70.1% |
| Immigrants | Bulgaria | 99.8 /100 | #47 | Exceptional 70.0% |
| Immigrants | Netherlands | 99.8 /100 | #48 | Exceptional 70.0% |
| Immigrants | Austria | 99.8 /100 | #49 | Exceptional 70.0% |
| Zimbabweans | 99.8 /100 | #50 | Exceptional 69.9% |
| Mongolians | 99.8 /100 | #51 | Exceptional 69.9% |
| Immigrants | Russia | 99.8 /100 | #52 | Exceptional 69.9% |
| South Africans | 99.7 /100 | #53 | Exceptional 69.7% |
| Immigrants | Czechoslovakia | 99.7 /100 | #54 | Exceptional 69.6% |
| Maltese | 99.7 /100 | #55 | Exceptional 69.5% |
| Immigrants | Scotland | 99.6 /100 | #56 | Exceptional 69.4% |
| Asians | 99.6 /100 | #57 | Exceptional 69.4% |
| Immigrants | Malaysia | 99.6 /100 | #58 | Exceptional 69.3% |
| Immigrants | Serbia | 99.5 /100 | #59 | Exceptional 69.3% |