Cape Verdean vs Czech College, Under 1 year
COMPARE
Cape Verdean
Czech
College, Under 1 year
College, Under 1 year Comparison
Cape Verdeans
Czechs
56.0%
COLLEGE, UNDER 1 YEAR
0.0/ 100
METRIC RATING
328th/ 347
METRIC RANK
67.1%
COLLEGE, UNDER 1 YEAR
90.8/ 100
METRIC RATING
127th/ 347
METRIC RANK
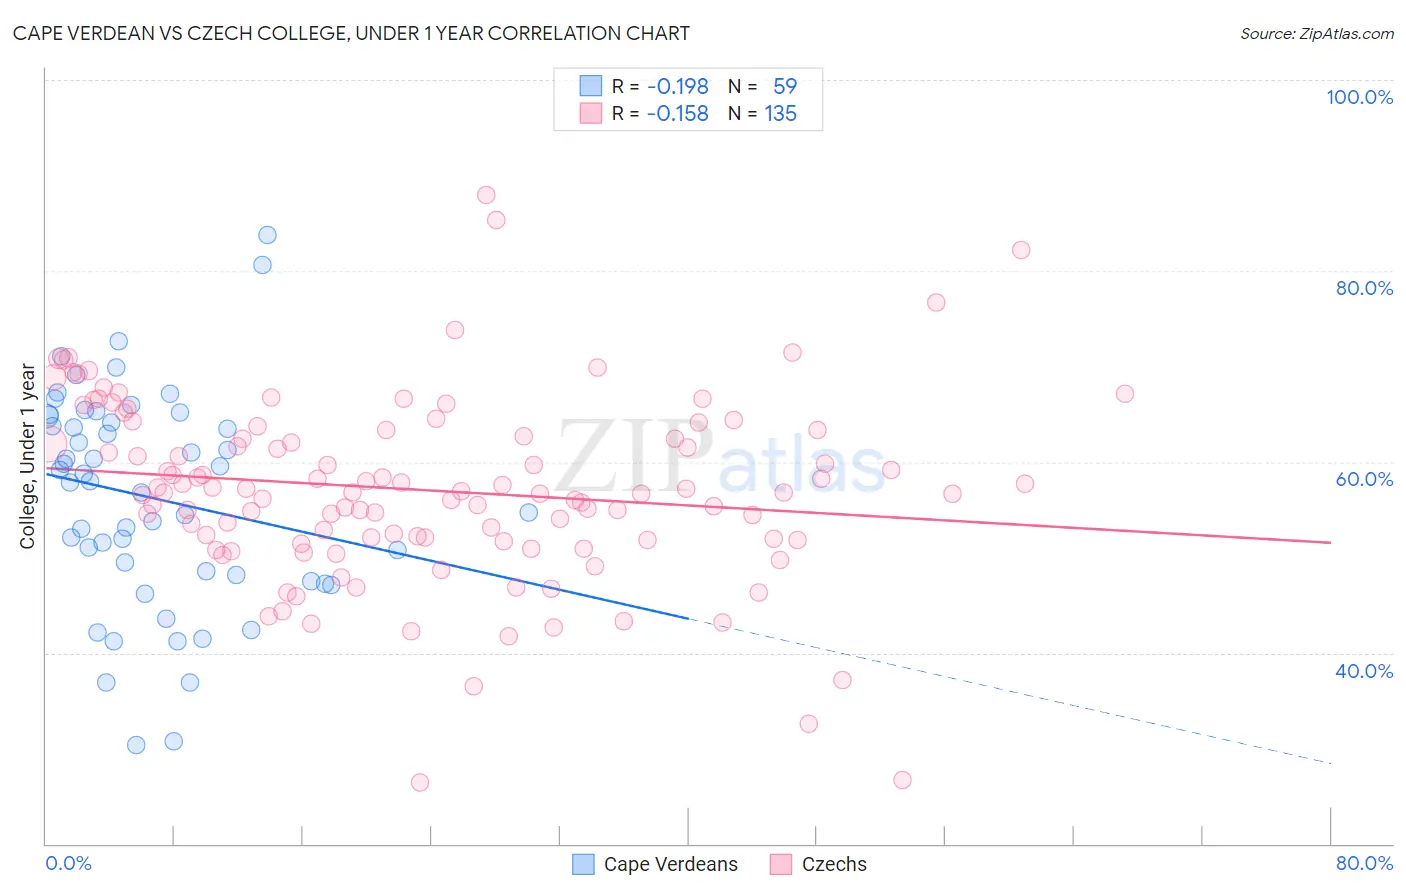
Cape Verdean vs Czech College, Under 1 year Correlation Chart
The statistical analysis conducted on geographies consisting of 107,580,652 people shows a poor negative correlation between the proportion of Cape Verdeans and percentage of population with at least college, under 1 year education in the United States with a correlation coefficient (R) of -0.198 and weighted average of 56.0%. Similarly, the statistical analysis conducted on geographies consisting of 484,811,480 people shows a poor negative correlation between the proportion of Czechs and percentage of population with at least college, under 1 year education in the United States with a correlation coefficient (R) of -0.158 and weighted average of 67.1%, a difference of 19.7%.
College, Under 1 year Correlation Summary
| Measurement | Cape Verdean | Czech |
| Minimum | 30.4% | 26.5% |
| Maximum | 83.7% | 88.0% |
| Range | 53.4% | 61.5% |
| Mean | 56.3% | 57.1% |
| Median | 58.0% | 56.8% |
| Interquartile 25% (IQ1) | 48.2% | 51.8% |
| Interquartile 75% (IQ3) | 64.8% | 63.3% |
| Interquartile Range (IQR) | 16.6% | 11.5% |
| Standard Deviation (Sample) | 11.3% | 9.8% |
| Standard Deviation (Population) | 11.2% | 9.8% |
Similar Demographics by College, Under 1 year
Demographics Similar to Cape Verdeans by College, Under 1 year
In terms of college, under 1 year, the demographic groups most similar to Cape Verdeans are Immigrants from Guatemala (56.2%, a difference of 0.29%), Navajo (56.3%, a difference of 0.38%), Immigrants from Latin America (56.3%, a difference of 0.53%), Immigrants from Cuba (55.7%, a difference of 0.62%), and Immigrants from El Salvador (56.4%, a difference of 0.63%).
| Demographics | Rating | Rank | College, Under 1 year |
| Natives/Alaskans | 0.0 /100 | #321 | Tragic 56.6% |
| Immigrants | Caribbean | 0.0 /100 | #322 | Tragic 56.6% |
| Immigrants | Honduras | 0.0 /100 | #323 | Tragic 56.5% |
| Immigrants | El Salvador | 0.0 /100 | #324 | Tragic 56.4% |
| Immigrants | Latin America | 0.0 /100 | #325 | Tragic 56.3% |
| Navajo | 0.0 /100 | #326 | Tragic 56.3% |
| Immigrants | Guatemala | 0.0 /100 | #327 | Tragic 56.2% |
| Cape Verdeans | 0.0 /100 | #328 | Tragic 56.0% |
| Immigrants | Cuba | 0.0 /100 | #329 | Tragic 55.7% |
| Mexicans | 0.0 /100 | #330 | Tragic 55.6% |
| Dominicans | 0.0 /100 | #331 | Tragic 55.5% |
| Immigrants | Yemen | 0.0 /100 | #332 | Tragic 55.3% |
| Yuman | 0.0 /100 | #333 | Tragic 55.1% |
| Immigrants | Azores | 0.0 /100 | #334 | Tragic 54.7% |
| Inupiat | 0.0 /100 | #335 | Tragic 54.6% |
Demographics Similar to Czechs by College, Under 1 year
In terms of college, under 1 year, the demographic groups most similar to Czechs are Scottish (67.0%, a difference of 0.070%), Alsatian (67.1%, a difference of 0.080%), Italian (67.2%, a difference of 0.14%), Immigrants from Eastern Africa (67.0%, a difference of 0.15%), and Immigrants from Syria (66.9%, a difference of 0.21%).
| Demographics | Rating | Rank | College, Under 1 year |
| Serbians | 93.9 /100 | #120 | Exceptional 67.4% |
| Slovenes | 93.3 /100 | #121 | Exceptional 67.3% |
| Immigrants | Jordan | 92.8 /100 | #122 | Exceptional 67.3% |
| Immigrants | Northern Africa | 92.7 /100 | #123 | Exceptional 67.2% |
| Arabs | 92.6 /100 | #124 | Exceptional 67.2% |
| Italians | 91.8 /100 | #125 | Exceptional 67.2% |
| Alsatians | 91.3 /100 | #126 | Exceptional 67.1% |
| Czechs | 90.8 /100 | #127 | Exceptional 67.1% |
| Scottish | 90.2 /100 | #128 | Exceptional 67.0% |
| Immigrants | Eastern Africa | 89.5 /100 | #129 | Excellent 67.0% |
| Immigrants | Syria | 89.0 /100 | #130 | Excellent 66.9% |
| Finns | 88.6 /100 | #131 | Excellent 66.9% |
| Poles | 88.4 /100 | #132 | Excellent 66.9% |
| Immigrants | Brazil | 88.3 /100 | #133 | Excellent 66.9% |
| Iraqis | 88.0 /100 | #134 | Excellent 66.8% |