Bolivian vs Australian College, Under 1 year
COMPARE
Bolivian
Australian
College, Under 1 year
College, Under 1 year Comparison
Bolivians
Australians
68.7%
COLLEGE, UNDER 1 YEAR
99.0/ 100
METRIC RATING
72nd/ 347
METRIC RANK
70.4%
COLLEGE, UNDER 1 YEAR
99.9/ 100
METRIC RATING
38th/ 347
METRIC RANK
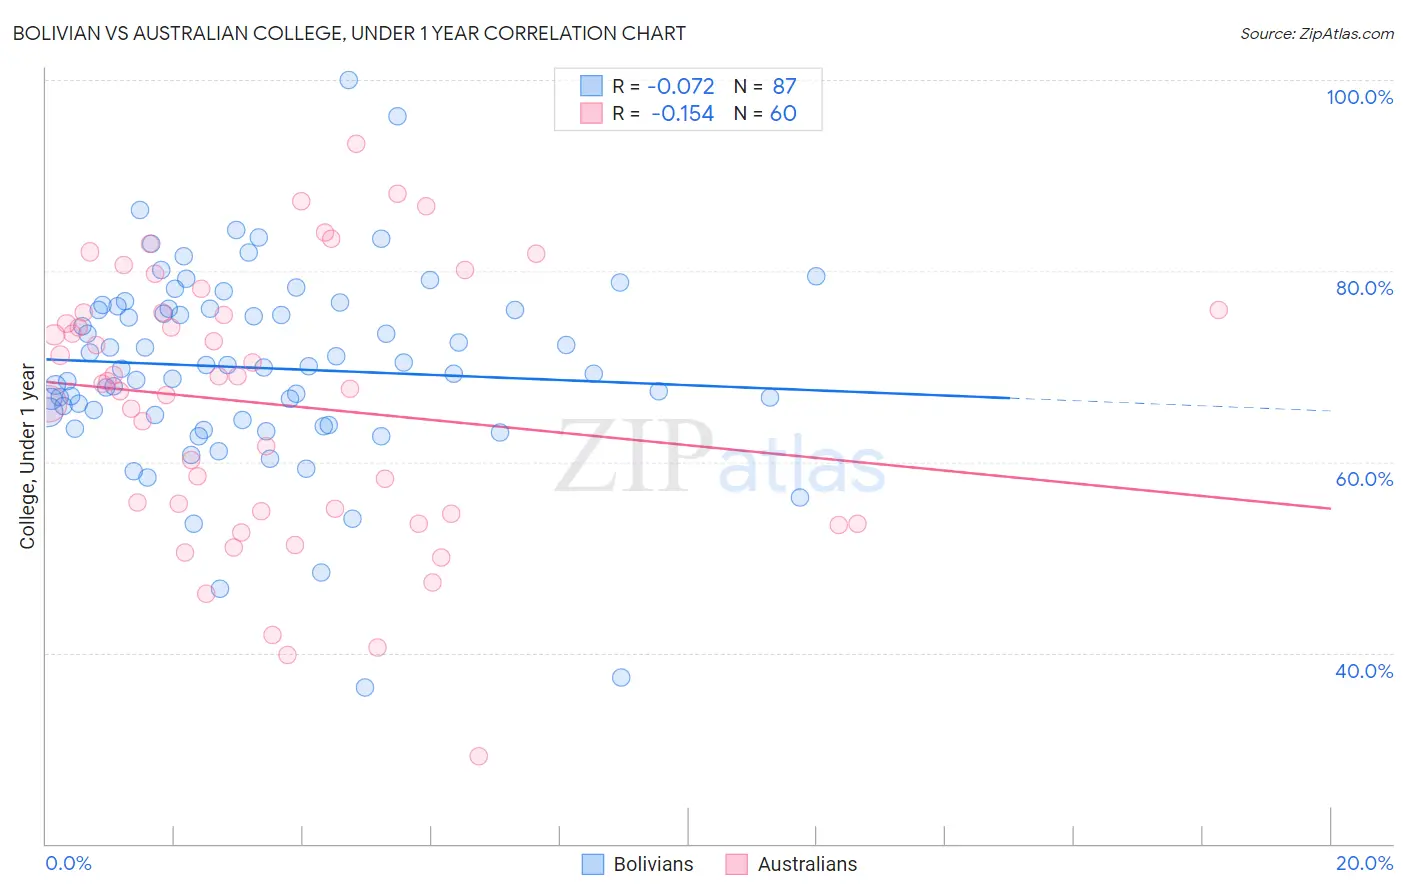
Bolivian vs Australian College, Under 1 year Correlation Chart
The statistical analysis conducted on geographies consisting of 184,667,998 people shows a slight negative correlation between the proportion of Bolivians and percentage of population with at least college, under 1 year education in the United States with a correlation coefficient (R) of -0.072 and weighted average of 68.7%. Similarly, the statistical analysis conducted on geographies consisting of 224,162,526 people shows a poor negative correlation between the proportion of Australians and percentage of population with at least college, under 1 year education in the United States with a correlation coefficient (R) of -0.154 and weighted average of 70.4%, a difference of 2.4%.
College, Under 1 year Correlation Summary
| Measurement | Bolivian | Australian |
| Minimum | 36.3% | 29.1% |
| Maximum | 100.0% | 93.4% |
| Range | 63.7% | 64.2% |
| Mean | 69.8% | 66.0% |
| Median | 69.8% | 68.3% |
| Interquartile 25% (IQ1) | 64.4% | 54.7% |
| Interquartile 75% (IQ3) | 76.1% | 75.6% |
| Interquartile Range (IQR) | 11.7% | 21.0% |
| Standard Deviation (Sample) | 10.3% | 14.0% |
| Standard Deviation (Population) | 10.3% | 13.8% |
Similar Demographics by College, Under 1 year
Demographics Similar to Bolivians by College, Under 1 year
In terms of college, under 1 year, the demographic groups most similar to Bolivians are Immigrants from Europe (68.8%, a difference of 0.040%), Immigrants from England (68.7%, a difference of 0.040%), Lithuanian (68.8%, a difference of 0.060%), Swedish (68.7%, a difference of 0.090%), and Immigrants from Romania (68.9%, a difference of 0.22%).
| Demographics | Rating | Rank | College, Under 1 year |
| Immigrants | Moldova | 99.3 /100 | #65 | Exceptional 69.0% |
| Immigrants | North America | 99.3 /100 | #66 | Exceptional 69.0% |
| Immigrants | Zimbabwe | 99.2 /100 | #67 | Exceptional 68.9% |
| Immigrants | Indonesia | 99.2 /100 | #68 | Exceptional 68.9% |
| Immigrants | Romania | 99.2 /100 | #69 | Exceptional 68.9% |
| Lithuanians | 99.1 /100 | #70 | Exceptional 68.8% |
| Immigrants | Europe | 99.1 /100 | #71 | Exceptional 68.8% |
| Bolivians | 99.0 /100 | #72 | Exceptional 68.7% |
| Immigrants | England | 99.0 /100 | #73 | Exceptional 68.7% |
| Swedes | 98.9 /100 | #74 | Exceptional 68.7% |
| Immigrants | Western Europe | 98.6 /100 | #75 | Exceptional 68.5% |
| Laotians | 98.6 /100 | #76 | Exceptional 68.5% |
| British | 98.6 /100 | #77 | Exceptional 68.5% |
| Danes | 98.6 /100 | #78 | Exceptional 68.5% |
| Greeks | 98.6 /100 | #79 | Exceptional 68.5% |
Demographics Similar to Australians by College, Under 1 year
In terms of college, under 1 year, the demographic groups most similar to Australians are Bhutanese (70.3%, a difference of 0.020%), Immigrants from Turkey (70.3%, a difference of 0.030%), Immigrants from Saudi Arabia (70.4%, a difference of 0.070%), Immigrants from Kuwait (70.3%, a difference of 0.070%), and Immigrants from Lithuania (70.3%, a difference of 0.11%).
| Demographics | Rating | Rank | College, Under 1 year |
| Indians (Asian) | 99.9 /100 | #31 | Exceptional 70.8% |
| Turks | 99.9 /100 | #32 | Exceptional 70.7% |
| Immigrants | South Africa | 99.9 /100 | #33 | Exceptional 70.6% |
| Estonians | 99.9 /100 | #34 | Exceptional 70.6% |
| Russians | 99.9 /100 | #35 | Exceptional 70.5% |
| Immigrants | Sri Lanka | 99.9 /100 | #36 | Exceptional 70.5% |
| Immigrants | Saudi Arabia | 99.9 /100 | #37 | Exceptional 70.4% |
| Australians | 99.9 /100 | #38 | Exceptional 70.4% |
| Bhutanese | 99.9 /100 | #39 | Exceptional 70.3% |
| Immigrants | Turkey | 99.9 /100 | #40 | Exceptional 70.3% |
| Immigrants | Kuwait | 99.9 /100 | #41 | Exceptional 70.3% |
| Immigrants | Lithuania | 99.9 /100 | #42 | Exceptional 70.3% |
| Israelis | 99.9 /100 | #43 | Exceptional 70.2% |
| New Zealanders | 99.9 /100 | #44 | Exceptional 70.2% |
| Immigrants | Norway | 99.9 /100 | #45 | Exceptional 70.2% |