Bolivian vs Guatemalan College, Under 1 year
COMPARE
Bolivian
Guatemalan
College, Under 1 year
College, Under 1 year Comparison
Bolivians
Guatemalans
68.7%
COLLEGE, UNDER 1 YEAR
99.0/ 100
METRIC RATING
72nd/ 347
METRIC RANK
56.8%
COLLEGE, UNDER 1 YEAR
0.0/ 100
METRIC RATING
320th/ 347
METRIC RANK
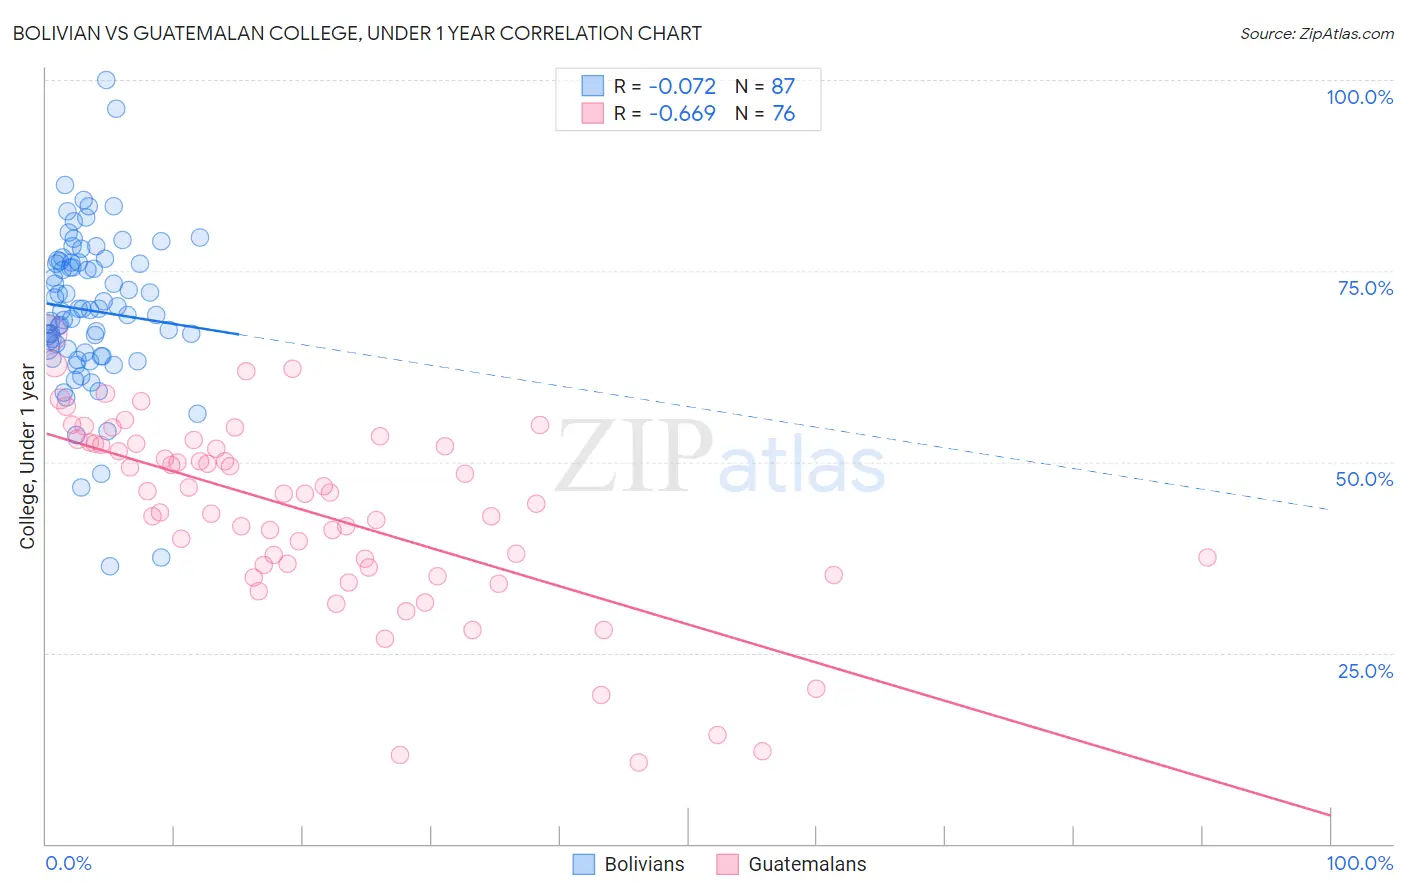
Bolivian vs Guatemalan College, Under 1 year Correlation Chart
The statistical analysis conducted on geographies consisting of 184,667,998 people shows a slight negative correlation between the proportion of Bolivians and percentage of population with at least college, under 1 year education in the United States with a correlation coefficient (R) of -0.072 and weighted average of 68.7%. Similarly, the statistical analysis conducted on geographies consisting of 409,563,856 people shows a significant negative correlation between the proportion of Guatemalans and percentage of population with at least college, under 1 year education in the United States with a correlation coefficient (R) of -0.669 and weighted average of 56.8%, a difference of 21.0%.
College, Under 1 year Correlation Summary
| Measurement | Bolivian | Guatemalan |
| Minimum | 36.3% | 10.7% |
| Maximum | 100.0% | 66.9% |
| Range | 63.7% | 56.2% |
| Mean | 69.8% | 43.4% |
| Median | 69.8% | 45.8% |
| Interquartile 25% (IQ1) | 64.4% | 36.4% |
| Interquartile 75% (IQ3) | 76.1% | 52.4% |
| Interquartile Range (IQR) | 11.7% | 16.0% |
| Standard Deviation (Sample) | 10.3% | 12.4% |
| Standard Deviation (Population) | 10.3% | 12.3% |
Similar Demographics by College, Under 1 year
Demographics Similar to Bolivians by College, Under 1 year
In terms of college, under 1 year, the demographic groups most similar to Bolivians are Immigrants from Europe (68.8%, a difference of 0.040%), Immigrants from England (68.7%, a difference of 0.040%), Lithuanian (68.8%, a difference of 0.060%), Swedish (68.7%, a difference of 0.090%), and Immigrants from Romania (68.9%, a difference of 0.22%).
| Demographics | Rating | Rank | College, Under 1 year |
| Immigrants | Moldova | 99.3 /100 | #65 | Exceptional 69.0% |
| Immigrants | North America | 99.3 /100 | #66 | Exceptional 69.0% |
| Immigrants | Zimbabwe | 99.2 /100 | #67 | Exceptional 68.9% |
| Immigrants | Indonesia | 99.2 /100 | #68 | Exceptional 68.9% |
| Immigrants | Romania | 99.2 /100 | #69 | Exceptional 68.9% |
| Lithuanians | 99.1 /100 | #70 | Exceptional 68.8% |
| Immigrants | Europe | 99.1 /100 | #71 | Exceptional 68.8% |
| Bolivians | 99.0 /100 | #72 | Exceptional 68.7% |
| Immigrants | England | 99.0 /100 | #73 | Exceptional 68.7% |
| Swedes | 98.9 /100 | #74 | Exceptional 68.7% |
| Immigrants | Western Europe | 98.6 /100 | #75 | Exceptional 68.5% |
| Laotians | 98.6 /100 | #76 | Exceptional 68.5% |
| British | 98.6 /100 | #77 | Exceptional 68.5% |
| Danes | 98.6 /100 | #78 | Exceptional 68.5% |
| Greeks | 98.6 /100 | #79 | Exceptional 68.5% |
Demographics Similar to Guatemalans by College, Under 1 year
In terms of college, under 1 year, the demographic groups most similar to Guatemalans are Puerto Rican (56.8%, a difference of 0.060%), Native/Alaskan (56.6%, a difference of 0.26%), Immigrants from Haiti (56.9%, a difference of 0.27%), Hispanic or Latino (57.0%, a difference of 0.38%), and Immigrants from Caribbean (56.6%, a difference of 0.39%).
| Demographics | Rating | Rank | College, Under 1 year |
| Dutch West Indians | 0.0 /100 | #313 | Tragic 57.2% |
| Hopi | 0.0 /100 | #314 | Tragic 57.1% |
| Hondurans | 0.0 /100 | #315 | Tragic 57.1% |
| Menominee | 0.0 /100 | #316 | Tragic 57.0% |
| Hispanics or Latinos | 0.0 /100 | #317 | Tragic 57.0% |
| Immigrants | Haiti | 0.0 /100 | #318 | Tragic 56.9% |
| Puerto Ricans | 0.0 /100 | #319 | Tragic 56.8% |
| Guatemalans | 0.0 /100 | #320 | Tragic 56.8% |
| Natives/Alaskans | 0.0 /100 | #321 | Tragic 56.6% |
| Immigrants | Caribbean | 0.0 /100 | #322 | Tragic 56.6% |
| Immigrants | Honduras | 0.0 /100 | #323 | Tragic 56.5% |
| Immigrants | El Salvador | 0.0 /100 | #324 | Tragic 56.4% |
| Immigrants | Latin America | 0.0 /100 | #325 | Tragic 56.3% |
| Navajo | 0.0 /100 | #326 | Tragic 56.3% |
| Immigrants | Guatemala | 0.0 /100 | #327 | Tragic 56.2% |