Welsh vs Immigrants from Australia Male Disability
COMPARE
Welsh
Immigrants from Australia
Male Disability
Male Disability Comparison
Welsh
Immigrants from Australia
12.7%
MALE DISABILITY
0.0/ 100
METRIC RATING
285th/ 347
METRIC RANK
10.4%
MALE DISABILITY
99.5/ 100
METRIC RATING
59th/ 347
METRIC RANK
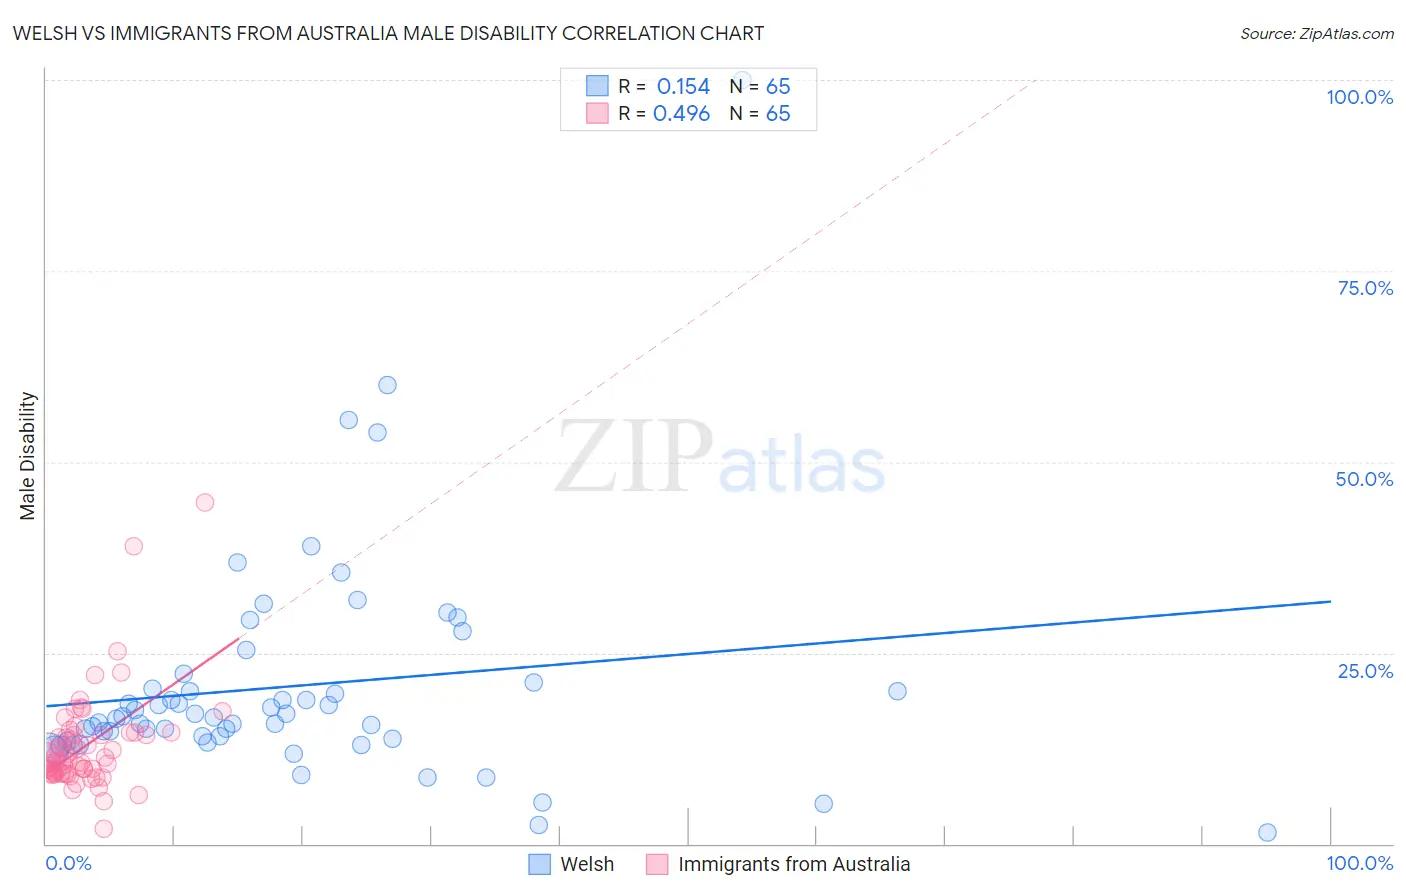
Welsh vs Immigrants from Australia Male Disability Correlation Chart
The statistical analysis conducted on geographies consisting of 528,469,982 people shows a poor positive correlation between the proportion of Welsh and percentage of males with a disability in the United States with a correlation coefficient (R) of 0.154 and weighted average of 12.7%. Similarly, the statistical analysis conducted on geographies consisting of 227,204,405 people shows a moderate positive correlation between the proportion of Immigrants from Australia and percentage of males with a disability in the United States with a correlation coefficient (R) of 0.496 and weighted average of 10.4%, a difference of 22.6%.
Male Disability Correlation Summary
| Measurement | Welsh | Immigrants from Australia |
| Minimum | 1.4% | 2.0% |
| Maximum | 100.0% | 44.7% |
| Range | 98.6% | 42.7% |
| Mean | 20.6% | 12.8% |
| Median | 16.6% | 10.9% |
| Interquartile 25% (IQ1) | 13.5% | 9.2% |
| Interquartile 75% (IQ3) | 20.7% | 14.4% |
| Interquartile Range (IQR) | 7.1% | 5.2% |
| Standard Deviation (Sample) | 15.0% | 6.6% |
| Standard Deviation (Population) | 14.8% | 6.6% |
Similar Demographics by Male Disability
Demographics Similar to Welsh by Male Disability
In terms of male disability, the demographic groups most similar to Welsh are Spanish (12.7%, a difference of 0.0%), Scottish (12.8%, a difference of 0.050%), Cape Verdean (12.8%, a difference of 0.12%), German (12.7%, a difference of 0.27%), and Irish (12.7%, a difference of 0.28%).
| Demographics | Rating | Rank | Male Disability |
| Central American Indians | 0.0 /100 | #278 | Tragic 12.7% |
| Slovaks | 0.0 /100 | #279 | Tragic 12.7% |
| Dutch | 0.0 /100 | #280 | Tragic 12.7% |
| Sioux | 0.0 /100 | #281 | Tragic 12.7% |
| Irish | 0.0 /100 | #282 | Tragic 12.7% |
| Germans | 0.0 /100 | #283 | Tragic 12.7% |
| Spanish | 0.0 /100 | #284 | Tragic 12.7% |
| Welsh | 0.0 /100 | #285 | Tragic 12.7% |
| Scottish | 0.0 /100 | #286 | Tragic 12.8% |
| Cape Verdeans | 0.0 /100 | #287 | Tragic 12.8% |
| Yup'ik | 0.0 /100 | #288 | Tragic 12.8% |
| Immigrants | Cabo Verde | 0.0 /100 | #289 | Tragic 12.8% |
| Pima | 0.0 /100 | #290 | Tragic 12.8% |
| Whites/Caucasians | 0.0 /100 | #291 | Tragic 12.8% |
| English | 0.0 /100 | #292 | Tragic 12.8% |
Demographics Similar to Immigrants from Australia by Male Disability
In terms of male disability, the demographic groups most similar to Immigrants from Australia are Immigrants from Colombia (10.4%, a difference of 0.060%), Immigrants from Japan (10.4%, a difference of 0.14%), Immigrants from Northern Africa (10.4%, a difference of 0.15%), Immigrants from South America (10.4%, a difference of 0.22%), and Tongan (10.4%, a difference of 0.24%).
| Demographics | Rating | Rank | Male Disability |
| Immigrants | Saudi Arabia | 99.6 /100 | #52 | Exceptional 10.4% |
| Immigrants | Uzbekistan | 99.6 /100 | #53 | Exceptional 10.4% |
| Peruvians | 99.6 /100 | #54 | Exceptional 10.4% |
| Immigrants | Eritrea | 99.6 /100 | #55 | Exceptional 10.4% |
| Tongans | 99.6 /100 | #56 | Exceptional 10.4% |
| Immigrants | South America | 99.6 /100 | #57 | Exceptional 10.4% |
| Immigrants | Japan | 99.5 /100 | #58 | Exceptional 10.4% |
| Immigrants | Australia | 99.5 /100 | #59 | Exceptional 10.4% |
| Immigrants | Colombia | 99.5 /100 | #60 | Exceptional 10.4% |
| Immigrants | Northern Africa | 99.4 /100 | #61 | Exceptional 10.4% |
| Immigrants | Ecuador | 99.3 /100 | #62 | Exceptional 10.4% |
| Immigrants | Belarus | 99.3 /100 | #63 | Exceptional 10.4% |
| Jordanians | 99.3 /100 | #64 | Exceptional 10.5% |
| Immigrants | Grenada | 99.2 /100 | #65 | Exceptional 10.5% |
| Guyanese | 99.2 /100 | #66 | Exceptional 10.5% |