Welsh vs Ottawa Male Disability
COMPARE
Welsh
Ottawa
Male Disability
Male Disability Comparison
Welsh
Ottawa
12.7%
MALE DISABILITY
0.0/ 100
METRIC RATING
285th/ 347
METRIC RANK
14.1%
MALE DISABILITY
0.0/ 100
METRIC RATING
325th/ 347
METRIC RANK
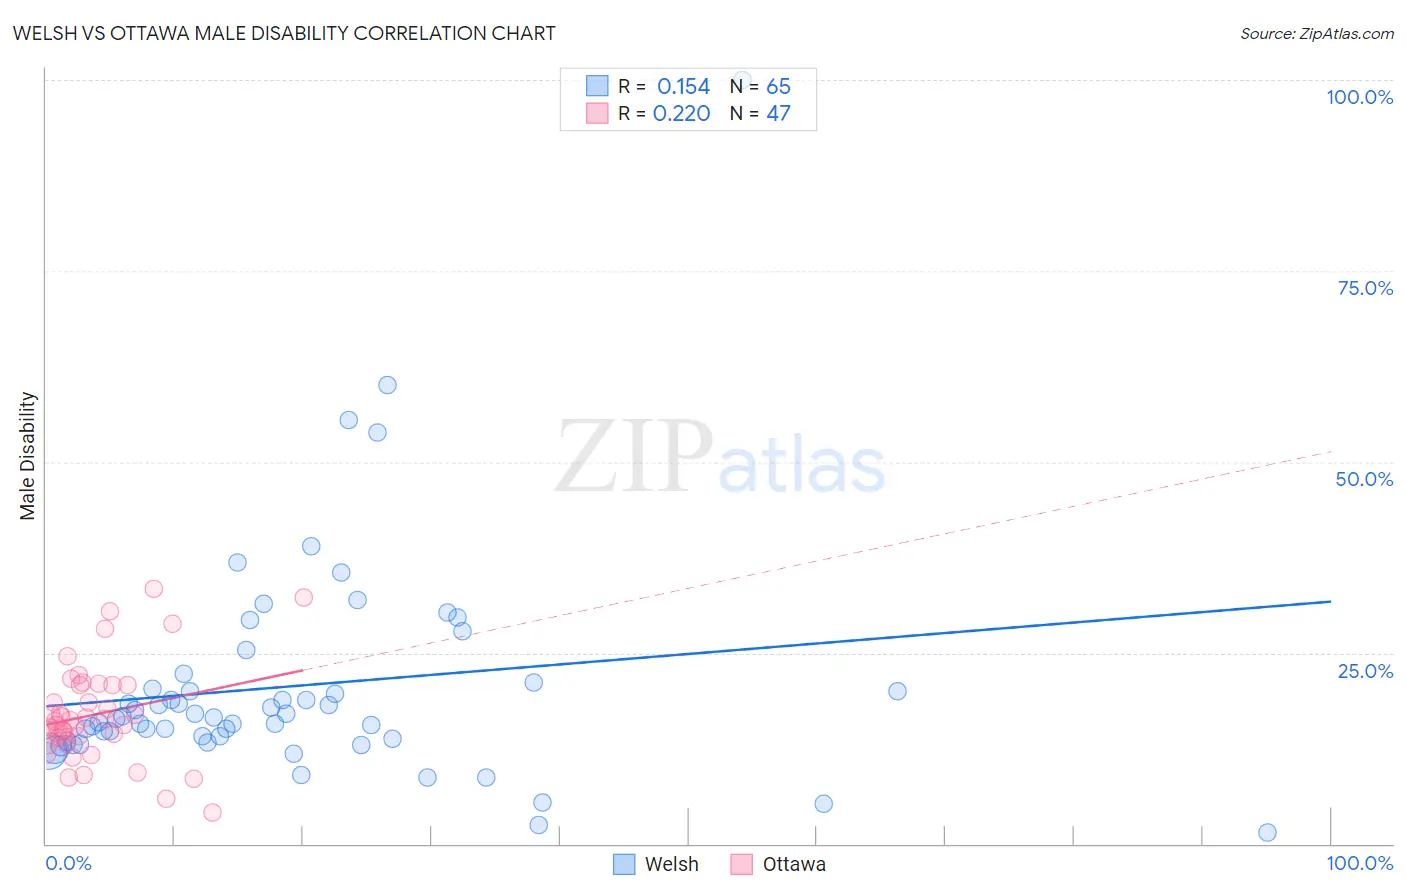
Welsh vs Ottawa Male Disability Correlation Chart
The statistical analysis conducted on geographies consisting of 528,469,982 people shows a poor positive correlation between the proportion of Welsh and percentage of males with a disability in the United States with a correlation coefficient (R) of 0.154 and weighted average of 12.7%. Similarly, the statistical analysis conducted on geographies consisting of 49,955,365 people shows a weak positive correlation between the proportion of Ottawa and percentage of males with a disability in the United States with a correlation coefficient (R) of 0.220 and weighted average of 14.1%, a difference of 10.4%.
Male Disability Correlation Summary
| Measurement | Welsh | Ottawa |
| Minimum | 1.4% | 4.1% |
| Maximum | 100.0% | 33.3% |
| Range | 98.6% | 29.3% |
| Mean | 20.6% | 16.9% |
| Median | 16.6% | 16.0% |
| Interquartile 25% (IQ1) | 13.5% | 13.9% |
| Interquartile 75% (IQ3) | 20.7% | 20.7% |
| Interquartile Range (IQR) | 7.1% | 6.8% |
| Standard Deviation (Sample) | 15.0% | 6.4% |
| Standard Deviation (Population) | 14.8% | 6.3% |
Similar Demographics by Male Disability
Demographics Similar to Welsh by Male Disability
In terms of male disability, the demographic groups most similar to Welsh are Spanish (12.7%, a difference of 0.0%), Scottish (12.8%, a difference of 0.050%), Cape Verdean (12.8%, a difference of 0.12%), German (12.7%, a difference of 0.27%), and Irish (12.7%, a difference of 0.28%).
| Demographics | Rating | Rank | Male Disability |
| Central American Indians | 0.0 /100 | #278 | Tragic 12.7% |
| Slovaks | 0.0 /100 | #279 | Tragic 12.7% |
| Dutch | 0.0 /100 | #280 | Tragic 12.7% |
| Sioux | 0.0 /100 | #281 | Tragic 12.7% |
| Irish | 0.0 /100 | #282 | Tragic 12.7% |
| Germans | 0.0 /100 | #283 | Tragic 12.7% |
| Spanish | 0.0 /100 | #284 | Tragic 12.7% |
| Welsh | 0.0 /100 | #285 | Tragic 12.7% |
| Scottish | 0.0 /100 | #286 | Tragic 12.8% |
| Cape Verdeans | 0.0 /100 | #287 | Tragic 12.8% |
| Yup'ik | 0.0 /100 | #288 | Tragic 12.8% |
| Immigrants | Cabo Verde | 0.0 /100 | #289 | Tragic 12.8% |
| Pima | 0.0 /100 | #290 | Tragic 12.8% |
| Whites/Caucasians | 0.0 /100 | #291 | Tragic 12.8% |
| English | 0.0 /100 | #292 | Tragic 12.8% |
Demographics Similar to Ottawa by Male Disability
In terms of male disability, the demographic groups most similar to Ottawa are Comanche (14.1%, a difference of 0.11%), Osage (14.0%, a difference of 0.44%), Apache (14.0%, a difference of 0.51%), Native/Alaskan (14.2%, a difference of 0.94%), and Potawatomi (14.2%, a difference of 1.1%).
| Demographics | Rating | Rank | Male Disability |
| Cree | 0.0 /100 | #318 | Tragic 13.7% |
| Americans | 0.0 /100 | #319 | Tragic 13.8% |
| Tlingit-Haida | 0.0 /100 | #320 | Tragic 13.8% |
| Shoshone | 0.0 /100 | #321 | Tragic 13.8% |
| Apache | 0.0 /100 | #322 | Tragic 14.0% |
| Osage | 0.0 /100 | #323 | Tragic 14.0% |
| Comanche | 0.0 /100 | #324 | Tragic 14.1% |
| Ottawa | 0.0 /100 | #325 | Tragic 14.1% |
| Natives/Alaskans | 0.0 /100 | #326 | Tragic 14.2% |
| Potawatomi | 0.0 /100 | #327 | Tragic 14.2% |
| Chippewa | 0.0 /100 | #328 | Tragic 14.3% |
| Cajuns | 0.0 /100 | #329 | Tragic 14.4% |
| Navajo | 0.0 /100 | #330 | Tragic 14.4% |
| Tohono O'odham | 0.0 /100 | #331 | Tragic 14.6% |
| Seminole | 0.0 /100 | #332 | Tragic 14.7% |