Menominee vs Immigrants from Eritrea Male Disability
COMPARE
Menominee
Immigrants from Eritrea
Male Disability
Male Disability Comparison
Menominee
Immigrants from Eritrea
15.0%
MALE DISABILITY
0.0/ 100
METRIC RATING
337th/ 347
METRIC RANK
10.4%
MALE DISABILITY
99.6/ 100
METRIC RATING
55th/ 347
METRIC RANK
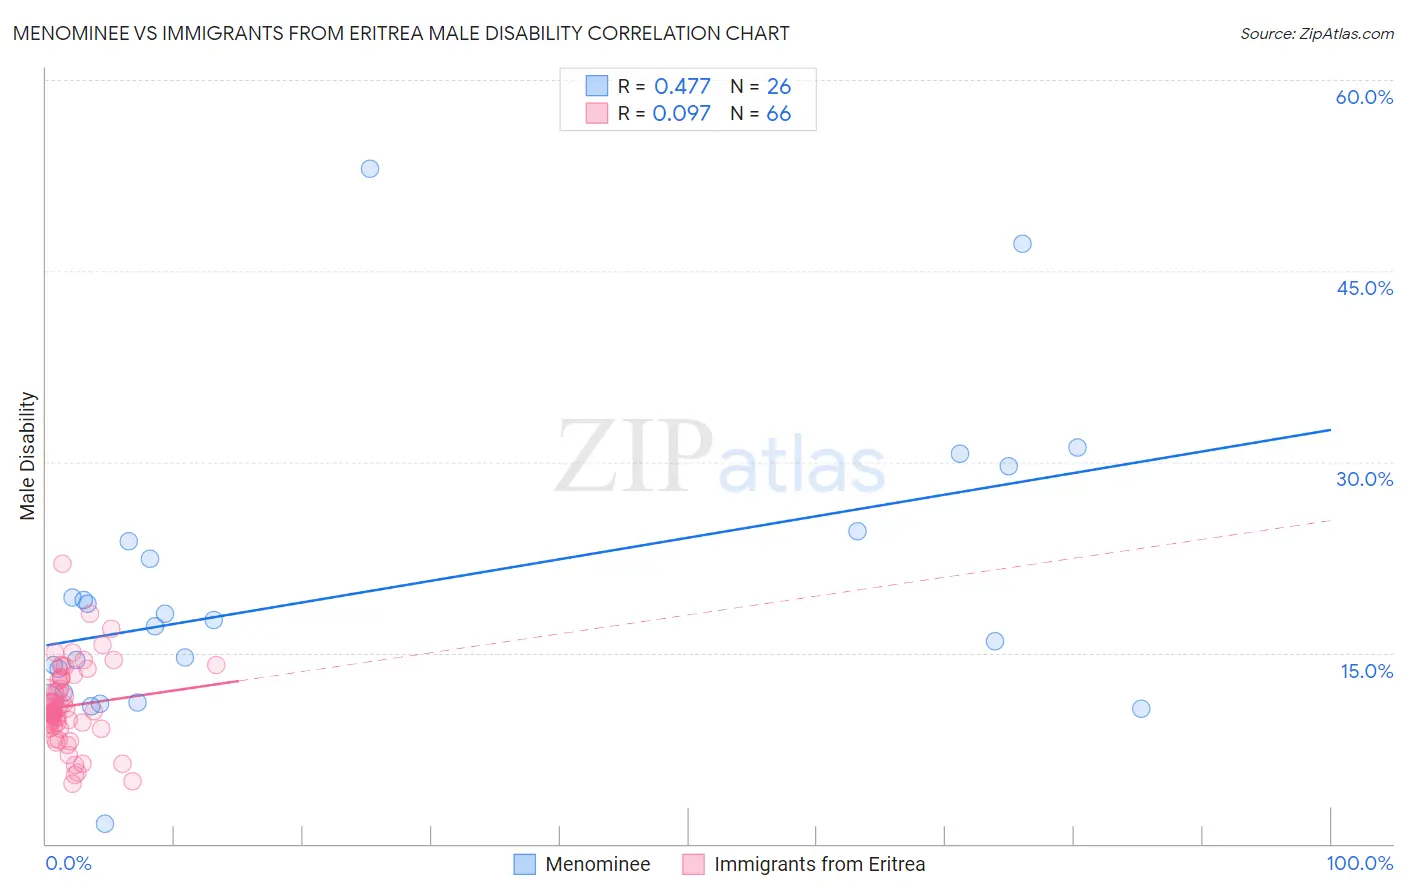
Menominee vs Immigrants from Eritrea Male Disability Correlation Chart
The statistical analysis conducted on geographies consisting of 45,777,737 people shows a moderate positive correlation between the proportion of Menominee and percentage of males with a disability in the United States with a correlation coefficient (R) of 0.477 and weighted average of 15.0%. Similarly, the statistical analysis conducted on geographies consisting of 104,852,788 people shows a slight positive correlation between the proportion of Immigrants from Eritrea and percentage of males with a disability in the United States with a correlation coefficient (R) of 0.097 and weighted average of 10.4%, a difference of 44.5%.
Male Disability Correlation Summary
| Measurement | Menominee | Immigrants from Eritrea |
| Minimum | 1.6% | 4.7% |
| Maximum | 53.0% | 22.0% |
| Range | 51.5% | 17.3% |
| Mean | 19.7% | 10.8% |
| Median | 17.4% | 10.4% |
| Interquartile 25% (IQ1) | 11.9% | 9.2% |
| Interquartile 75% (IQ3) | 23.8% | 13.0% |
| Interquartile Range (IQR) | 11.9% | 3.8% |
| Standard Deviation (Sample) | 11.3% | 3.2% |
| Standard Deviation (Population) | 11.1% | 3.1% |
Similar Demographics by Male Disability
Demographics Similar to Menominee by Male Disability
In terms of male disability, the demographic groups most similar to Menominee are Pueblo (15.0%, a difference of 0.11%), Alaskan Athabascan (14.9%, a difference of 0.51%), Chickasaw (15.1%, a difference of 0.91%), Dutch West Indian (14.8%, a difference of 0.97%), and Cherokee (14.8%, a difference of 1.0%).
| Demographics | Rating | Rank | Male Disability |
| Navajo | 0.0 /100 | #330 | Tragic 14.4% |
| Tohono O'odham | 0.0 /100 | #331 | Tragic 14.6% |
| Seminole | 0.0 /100 | #332 | Tragic 14.7% |
| Yuman | 0.0 /100 | #333 | Tragic 14.7% |
| Cherokee | 0.0 /100 | #334 | Tragic 14.8% |
| Dutch West Indians | 0.0 /100 | #335 | Tragic 14.8% |
| Alaskan Athabascans | 0.0 /100 | #336 | Tragic 14.9% |
| Menominee | 0.0 /100 | #337 | Tragic 15.0% |
| Pueblo | 0.0 /100 | #338 | Tragic 15.0% |
| Chickasaw | 0.0 /100 | #339 | Tragic 15.1% |
| Lumbee | 0.0 /100 | #340 | Tragic 15.2% |
| Choctaw | 0.0 /100 | #341 | Tragic 15.4% |
| Kiowa | 0.0 /100 | #342 | Tragic 15.4% |
| Creek | 0.0 /100 | #343 | Tragic 15.5% |
| Puerto Ricans | 0.0 /100 | #344 | Tragic 15.6% |
Demographics Similar to Immigrants from Eritrea by Male Disability
In terms of male disability, the demographic groups most similar to Immigrants from Eritrea are Peruvian (10.4%, a difference of 0.020%), Tongan (10.4%, a difference of 0.040%), Immigrants from Uzbekistan (10.4%, a difference of 0.060%), Immigrants from South America (10.4%, a difference of 0.060%), and Immigrants from Saudi Arabia (10.4%, a difference of 0.080%).
| Demographics | Rating | Rank | Male Disability |
| Israelis | 99.7 /100 | #48 | Exceptional 10.3% |
| Immigrants | Spain | 99.7 /100 | #49 | Exceptional 10.3% |
| South Americans | 99.6 /100 | #50 | Exceptional 10.3% |
| Salvadorans | 99.6 /100 | #51 | Exceptional 10.4% |
| Immigrants | Saudi Arabia | 99.6 /100 | #52 | Exceptional 10.4% |
| Immigrants | Uzbekistan | 99.6 /100 | #53 | Exceptional 10.4% |
| Peruvians | 99.6 /100 | #54 | Exceptional 10.4% |
| Immigrants | Eritrea | 99.6 /100 | #55 | Exceptional 10.4% |
| Tongans | 99.6 /100 | #56 | Exceptional 10.4% |
| Immigrants | South America | 99.6 /100 | #57 | Exceptional 10.4% |
| Immigrants | Japan | 99.5 /100 | #58 | Exceptional 10.4% |
| Immigrants | Australia | 99.5 /100 | #59 | Exceptional 10.4% |
| Immigrants | Colombia | 99.5 /100 | #60 | Exceptional 10.4% |
| Immigrants | Northern Africa | 99.4 /100 | #61 | Exceptional 10.4% |
| Immigrants | Ecuador | 99.3 /100 | #62 | Exceptional 10.4% |