Menominee vs Immigrants from Venezuela Male Disability
COMPARE
Menominee
Immigrants from Venezuela
Male Disability
Male Disability Comparison
Menominee
Immigrants from Venezuela
15.0%
MALE DISABILITY
0.0/ 100
METRIC RATING
337th/ 347
METRIC RANK
10.0%
MALE DISABILITY
100.0/ 100
METRIC RATING
22nd/ 347
METRIC RANK
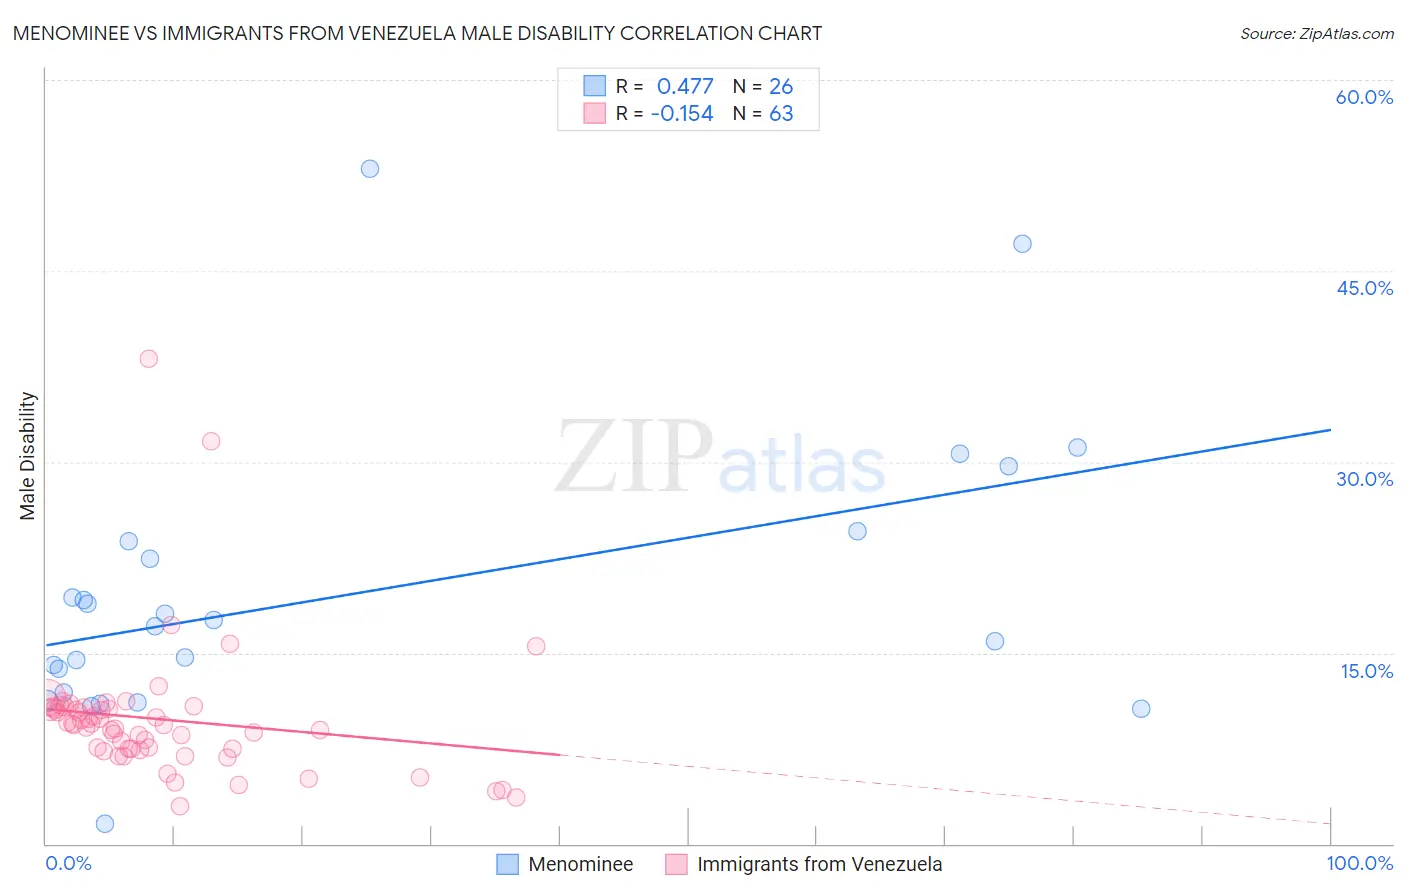
Menominee vs Immigrants from Venezuela Male Disability Correlation Chart
The statistical analysis conducted on geographies consisting of 45,777,737 people shows a moderate positive correlation between the proportion of Menominee and percentage of males with a disability in the United States with a correlation coefficient (R) of 0.477 and weighted average of 15.0%. Similarly, the statistical analysis conducted on geographies consisting of 287,855,210 people shows a poor negative correlation between the proportion of Immigrants from Venezuela and percentage of males with a disability in the United States with a correlation coefficient (R) of -0.154 and weighted average of 10.0%, a difference of 49.8%.
Male Disability Correlation Summary
| Measurement | Menominee | Immigrants from Venezuela |
| Minimum | 1.6% | 2.9% |
| Maximum | 53.0% | 38.1% |
| Range | 51.5% | 35.2% |
| Mean | 19.7% | 9.8% |
| Median | 17.4% | 9.3% |
| Interquartile 25% (IQ1) | 11.9% | 7.4% |
| Interquartile 75% (IQ3) | 23.8% | 10.7% |
| Interquartile Range (IQR) | 11.9% | 3.2% |
| Standard Deviation (Sample) | 11.3% | 5.3% |
| Standard Deviation (Population) | 11.1% | 5.3% |
Similar Demographics by Male Disability
Demographics Similar to Menominee by Male Disability
In terms of male disability, the demographic groups most similar to Menominee are Pueblo (15.0%, a difference of 0.11%), Alaskan Athabascan (14.9%, a difference of 0.51%), Chickasaw (15.1%, a difference of 0.91%), Dutch West Indian (14.8%, a difference of 0.97%), and Cherokee (14.8%, a difference of 1.0%).
| Demographics | Rating | Rank | Male Disability |
| Navajo | 0.0 /100 | #330 | Tragic 14.4% |
| Tohono O'odham | 0.0 /100 | #331 | Tragic 14.6% |
| Seminole | 0.0 /100 | #332 | Tragic 14.7% |
| Yuman | 0.0 /100 | #333 | Tragic 14.7% |
| Cherokee | 0.0 /100 | #334 | Tragic 14.8% |
| Dutch West Indians | 0.0 /100 | #335 | Tragic 14.8% |
| Alaskan Athabascans | 0.0 /100 | #336 | Tragic 14.9% |
| Menominee | 0.0 /100 | #337 | Tragic 15.0% |
| Pueblo | 0.0 /100 | #338 | Tragic 15.0% |
| Chickasaw | 0.0 /100 | #339 | Tragic 15.1% |
| Lumbee | 0.0 /100 | #340 | Tragic 15.2% |
| Choctaw | 0.0 /100 | #341 | Tragic 15.4% |
| Kiowa | 0.0 /100 | #342 | Tragic 15.4% |
| Creek | 0.0 /100 | #343 | Tragic 15.5% |
| Puerto Ricans | 0.0 /100 | #344 | Tragic 15.6% |
Demographics Similar to Immigrants from Venezuela by Male Disability
In terms of male disability, the demographic groups most similar to Immigrants from Venezuela are Cypriot (10.0%, a difference of 0.090%), Immigrants from Asia (10.0%, a difference of 0.23%), Burmese (10.0%, a difference of 0.29%), Asian (10.0%, a difference of 0.39%), and Immigrants from Malaysia (10.0%, a difference of 0.41%).
| Demographics | Rating | Rank | Male Disability |
| Indians (Asian) | 100.0 /100 | #15 | Exceptional 9.7% |
| Okinawans | 100.0 /100 | #16 | Exceptional 9.8% |
| Immigrants | Korea | 100.0 /100 | #17 | Exceptional 9.8% |
| Immigrants | Pakistan | 100.0 /100 | #18 | Exceptional 9.8% |
| Immigrants | Sri Lanka | 100.0 /100 | #19 | Exceptional 10.0% |
| Asians | 100.0 /100 | #20 | Exceptional 10.0% |
| Burmese | 100.0 /100 | #21 | Exceptional 10.0% |
| Immigrants | Venezuela | 100.0 /100 | #22 | Exceptional 10.0% |
| Cypriots | 100.0 /100 | #23 | Exceptional 10.0% |
| Immigrants | Asia | 100.0 /100 | #24 | Exceptional 10.0% |
| Immigrants | Malaysia | 99.9 /100 | #25 | Exceptional 10.0% |
| Paraguayans | 99.9 /100 | #26 | Exceptional 10.1% |
| Egyptians | 99.9 /100 | #27 | Exceptional 10.1% |
| Vietnamese | 99.9 /100 | #28 | Exceptional 10.1% |
| Venezuelans | 99.9 /100 | #29 | Exceptional 10.1% |