Ghanaian vs Puget Sound Salish Male Disability
COMPARE
Ghanaian
Puget Sound Salish
Male Disability
Male Disability Comparison
Ghanaians
Puget Sound Salish
10.8%
MALE DISABILITY
93.4/ 100
METRIC RATING
112th/ 347
METRIC RANK
13.5%
MALE DISABILITY
0.0/ 100
METRIC RATING
313th/ 347
METRIC RANK
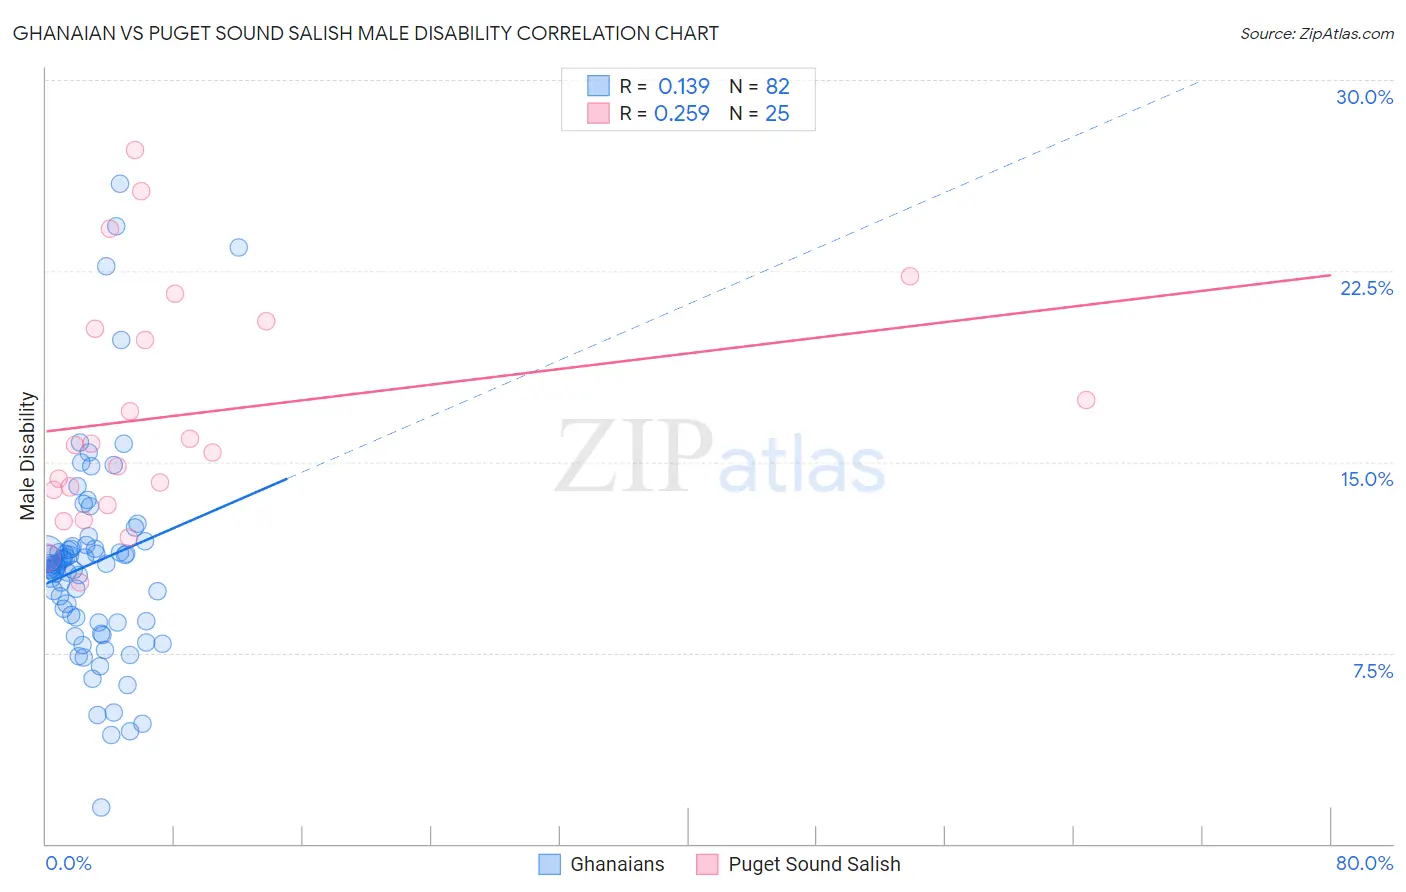
Ghanaian vs Puget Sound Salish Male Disability Correlation Chart
The statistical analysis conducted on geographies consisting of 190,687,278 people shows a poor positive correlation between the proportion of Ghanaians and percentage of males with a disability in the United States with a correlation coefficient (R) of 0.139 and weighted average of 10.8%. Similarly, the statistical analysis conducted on geographies consisting of 46,152,398 people shows a weak positive correlation between the proportion of Puget Sound Salish and percentage of males with a disability in the United States with a correlation coefficient (R) of 0.259 and weighted average of 13.5%, a difference of 25.3%.
Male Disability Correlation Summary
| Measurement | Ghanaian | Puget Sound Salish |
| Minimum | 1.4% | 10.3% |
| Maximum | 25.9% | 27.3% |
| Range | 24.5% | 17.0% |
| Mean | 11.0% | 16.9% |
| Median | 11.0% | 15.6% |
| Interquartile 25% (IQ1) | 8.7% | 13.6% |
| Interquartile 75% (IQ3) | 11.7% | 20.4% |
| Interquartile Range (IQR) | 3.0% | 6.8% |
| Standard Deviation (Sample) | 4.2% | 4.6% |
| Standard Deviation (Population) | 4.1% | 4.5% |
Similar Demographics by Male Disability
Demographics Similar to Ghanaians by Male Disability
In terms of male disability, the demographic groups most similar to Ghanaians are Immigrants from Zimbabwe (10.8%, a difference of 0.090%), Immigrants from Uruguay (10.8%, a difference of 0.10%), Immigrants (10.8%, a difference of 0.14%), Central American (10.8%, a difference of 0.15%), and Immigrants from Uganda (10.8%, a difference of 0.16%).
| Demographics | Rating | Rank | Male Disability |
| Immigrants | Brazil | 95.0 /100 | #105 | Exceptional 10.8% |
| Immigrants | Syria | 94.9 /100 | #106 | Exceptional 10.8% |
| Immigrants | Eastern Africa | 94.3 /100 | #107 | Exceptional 10.8% |
| Immigrants | Belgium | 94.2 /100 | #108 | Exceptional 10.8% |
| Immigrants | Uganda | 94.0 /100 | #109 | Exceptional 10.8% |
| Immigrants | Immigrants | 93.9 /100 | #110 | Exceptional 10.8% |
| Immigrants | Uruguay | 93.8 /100 | #111 | Exceptional 10.8% |
| Ghanaians | 93.4 /100 | #112 | Exceptional 10.8% |
| Immigrants | Zimbabwe | 93.0 /100 | #113 | Exceptional 10.8% |
| Central Americans | 92.7 /100 | #114 | Exceptional 10.8% |
| Immigrants | Barbados | 92.2 /100 | #115 | Exceptional 10.8% |
| Immigrants | South Africa | 91.8 /100 | #116 | Exceptional 10.8% |
| Eastern Europeans | 90.6 /100 | #117 | Exceptional 10.9% |
| Immigrants | Cuba | 90.2 /100 | #118 | Exceptional 10.9% |
| Armenians | 90.1 /100 | #119 | Exceptional 10.9% |
Demographics Similar to Puget Sound Salish by Male Disability
In terms of male disability, the demographic groups most similar to Puget Sound Salish are Yakama (13.5%, a difference of 0.020%), Aleut (13.5%, a difference of 0.060%), Iroquois (13.6%, a difference of 0.22%), Alaska Native (13.6%, a difference of 0.27%), and Delaware (13.5%, a difference of 0.57%).
| Demographics | Rating | Rank | Male Disability |
| Spanish Americans | 0.0 /100 | #306 | Tragic 13.3% |
| Arapaho | 0.0 /100 | #307 | Tragic 13.3% |
| French American Indians | 0.0 /100 | #308 | Tragic 13.4% |
| Blackfeet | 0.0 /100 | #309 | Tragic 13.4% |
| Immigrants | Azores | 0.0 /100 | #310 | Tragic 13.4% |
| Delaware | 0.0 /100 | #311 | Tragic 13.5% |
| Yakama | 0.0 /100 | #312 | Tragic 13.5% |
| Puget Sound Salish | 0.0 /100 | #313 | Tragic 13.5% |
| Aleuts | 0.0 /100 | #314 | Tragic 13.5% |
| Iroquois | 0.0 /100 | #315 | Tragic 13.6% |
| Alaska Natives | 0.0 /100 | #316 | Tragic 13.6% |
| Paiute | 0.0 /100 | #317 | Tragic 13.7% |
| Cree | 0.0 /100 | #318 | Tragic 13.7% |
| Americans | 0.0 /100 | #319 | Tragic 13.8% |
| Tlingit-Haida | 0.0 /100 | #320 | Tragic 13.8% |