Ghanaian vs Immigrants from Micronesia Male Disability
COMPARE
Ghanaian
Immigrants from Micronesia
Male Disability
Male Disability Comparison
Ghanaians
Immigrants from Micronesia
10.8%
MALE DISABILITY
93.4/ 100
METRIC RATING
112th/ 347
METRIC RANK
12.9%
MALE DISABILITY
0.0/ 100
METRIC RATING
295th/ 347
METRIC RANK
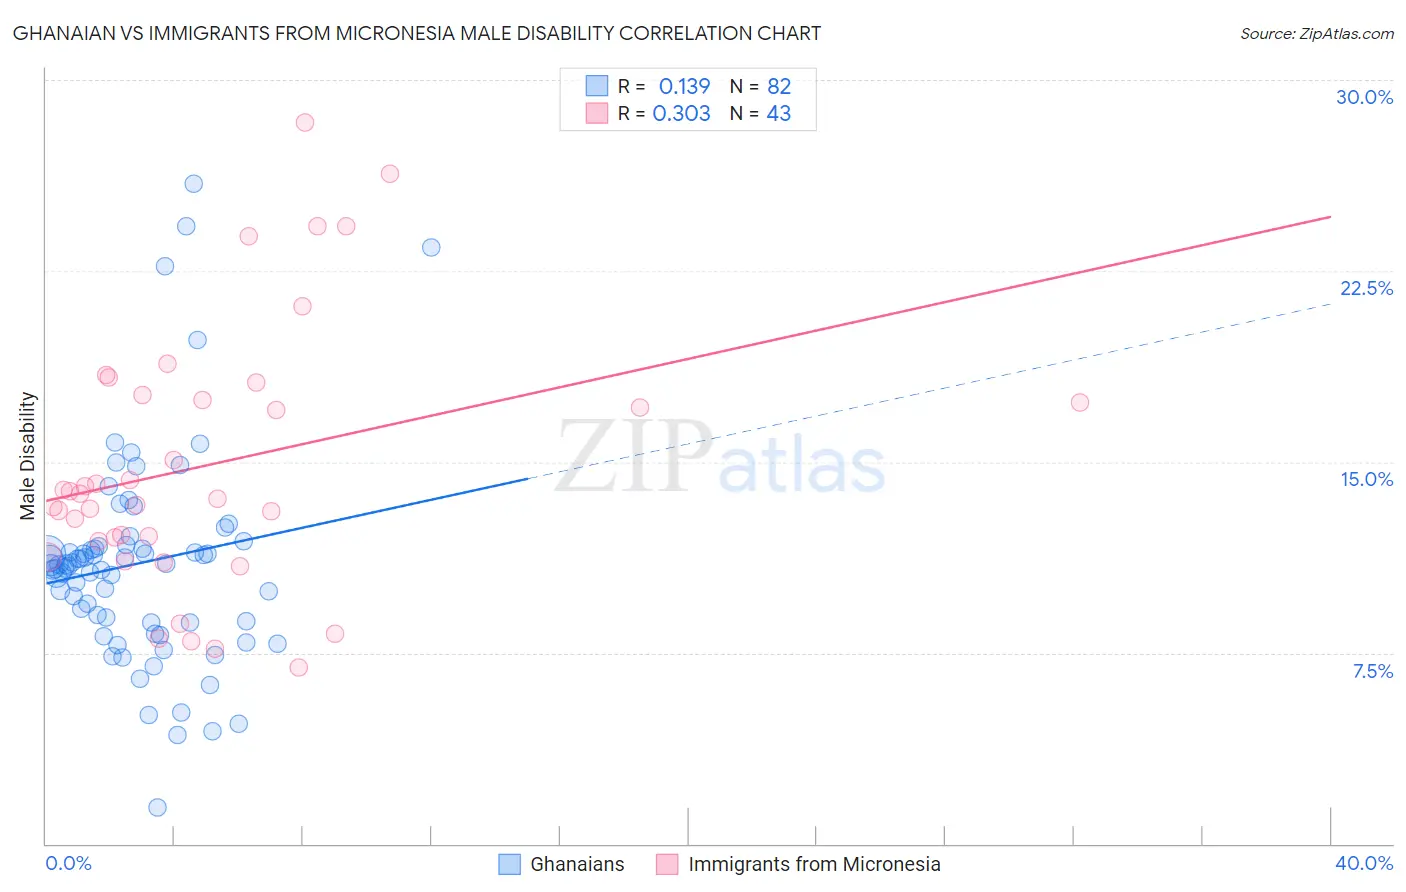
Ghanaian vs Immigrants from Micronesia Male Disability Correlation Chart
The statistical analysis conducted on geographies consisting of 190,687,278 people shows a poor positive correlation between the proportion of Ghanaians and percentage of males with a disability in the United States with a correlation coefficient (R) of 0.139 and weighted average of 10.8%. Similarly, the statistical analysis conducted on geographies consisting of 61,603,826 people shows a mild positive correlation between the proportion of Immigrants from Micronesia and percentage of males with a disability in the United States with a correlation coefficient (R) of 0.303 and weighted average of 12.9%, a difference of 19.7%.
Male Disability Correlation Summary
| Measurement | Ghanaian | Immigrants from Micronesia |
| Minimum | 1.4% | 6.9% |
| Maximum | 25.9% | 28.3% |
| Range | 24.5% | 21.4% |
| Mean | 11.0% | 14.9% |
| Median | 11.0% | 13.8% |
| Interquartile 25% (IQ1) | 8.7% | 11.9% |
| Interquartile 75% (IQ3) | 11.7% | 17.6% |
| Interquartile Range (IQR) | 3.0% | 5.7% |
| Standard Deviation (Sample) | 4.2% | 5.1% |
| Standard Deviation (Population) | 4.1% | 5.0% |
Similar Demographics by Male Disability
Demographics Similar to Ghanaians by Male Disability
In terms of male disability, the demographic groups most similar to Ghanaians are Immigrants from Zimbabwe (10.8%, a difference of 0.090%), Immigrants from Uruguay (10.8%, a difference of 0.10%), Immigrants (10.8%, a difference of 0.14%), Central American (10.8%, a difference of 0.15%), and Immigrants from Uganda (10.8%, a difference of 0.16%).
| Demographics | Rating | Rank | Male Disability |
| Immigrants | Brazil | 95.0 /100 | #105 | Exceptional 10.8% |
| Immigrants | Syria | 94.9 /100 | #106 | Exceptional 10.8% |
| Immigrants | Eastern Africa | 94.3 /100 | #107 | Exceptional 10.8% |
| Immigrants | Belgium | 94.2 /100 | #108 | Exceptional 10.8% |
| Immigrants | Uganda | 94.0 /100 | #109 | Exceptional 10.8% |
| Immigrants | Immigrants | 93.9 /100 | #110 | Exceptional 10.8% |
| Immigrants | Uruguay | 93.8 /100 | #111 | Exceptional 10.8% |
| Ghanaians | 93.4 /100 | #112 | Exceptional 10.8% |
| Immigrants | Zimbabwe | 93.0 /100 | #113 | Exceptional 10.8% |
| Central Americans | 92.7 /100 | #114 | Exceptional 10.8% |
| Immigrants | Barbados | 92.2 /100 | #115 | Exceptional 10.8% |
| Immigrants | South Africa | 91.8 /100 | #116 | Exceptional 10.8% |
| Eastern Europeans | 90.6 /100 | #117 | Exceptional 10.9% |
| Immigrants | Cuba | 90.2 /100 | #118 | Exceptional 10.9% |
| Armenians | 90.1 /100 | #119 | Exceptional 10.9% |
Demographics Similar to Immigrants from Micronesia by Male Disability
In terms of male disability, the demographic groups most similar to Immigrants from Micronesia are Nonimmigrants (12.9%, a difference of 0.070%), Marshallese (12.9%, a difference of 0.10%), Inupiat (13.0%, a difference of 0.17%), Yaqui (12.9%, a difference of 0.33%), and Pennsylvania German (13.0%, a difference of 0.37%).
| Demographics | Rating | Rank | Male Disability |
| Yup'ik | 0.0 /100 | #288 | Tragic 12.8% |
| Immigrants | Cabo Verde | 0.0 /100 | #289 | Tragic 12.8% |
| Pima | 0.0 /100 | #290 | Tragic 12.8% |
| Whites/Caucasians | 0.0 /100 | #291 | Tragic 12.8% |
| English | 0.0 /100 | #292 | Tragic 12.8% |
| Yaqui | 0.0 /100 | #293 | Tragic 12.9% |
| Marshallese | 0.0 /100 | #294 | Tragic 12.9% |
| Immigrants | Micronesia | 0.0 /100 | #295 | Tragic 12.9% |
| Immigrants | Nonimmigrants | 0.0 /100 | #296 | Tragic 12.9% |
| Inupiat | 0.0 /100 | #297 | Tragic 13.0% |
| Pennsylvania Germans | 0.0 /100 | #298 | Tragic 13.0% |
| Celtics | 0.0 /100 | #299 | Tragic 13.0% |
| Cheyenne | 0.0 /100 | #300 | Tragic 13.0% |
| French | 0.0 /100 | #301 | Tragic 13.0% |
| Crow | 0.0 /100 | #302 | Tragic 13.1% |