Austrian vs Immigrants from Jordan Male Disability
COMPARE
Austrian
Immigrants from Jordan
Male Disability
Male Disability Comparison
Austrians
Immigrants from Jordan
11.8%
MALE DISABILITY
2.5/ 100
METRIC RATING
227th/ 347
METRIC RANK
10.6%
MALE DISABILITY
98.4/ 100
METRIC RATING
80th/ 347
METRIC RANK
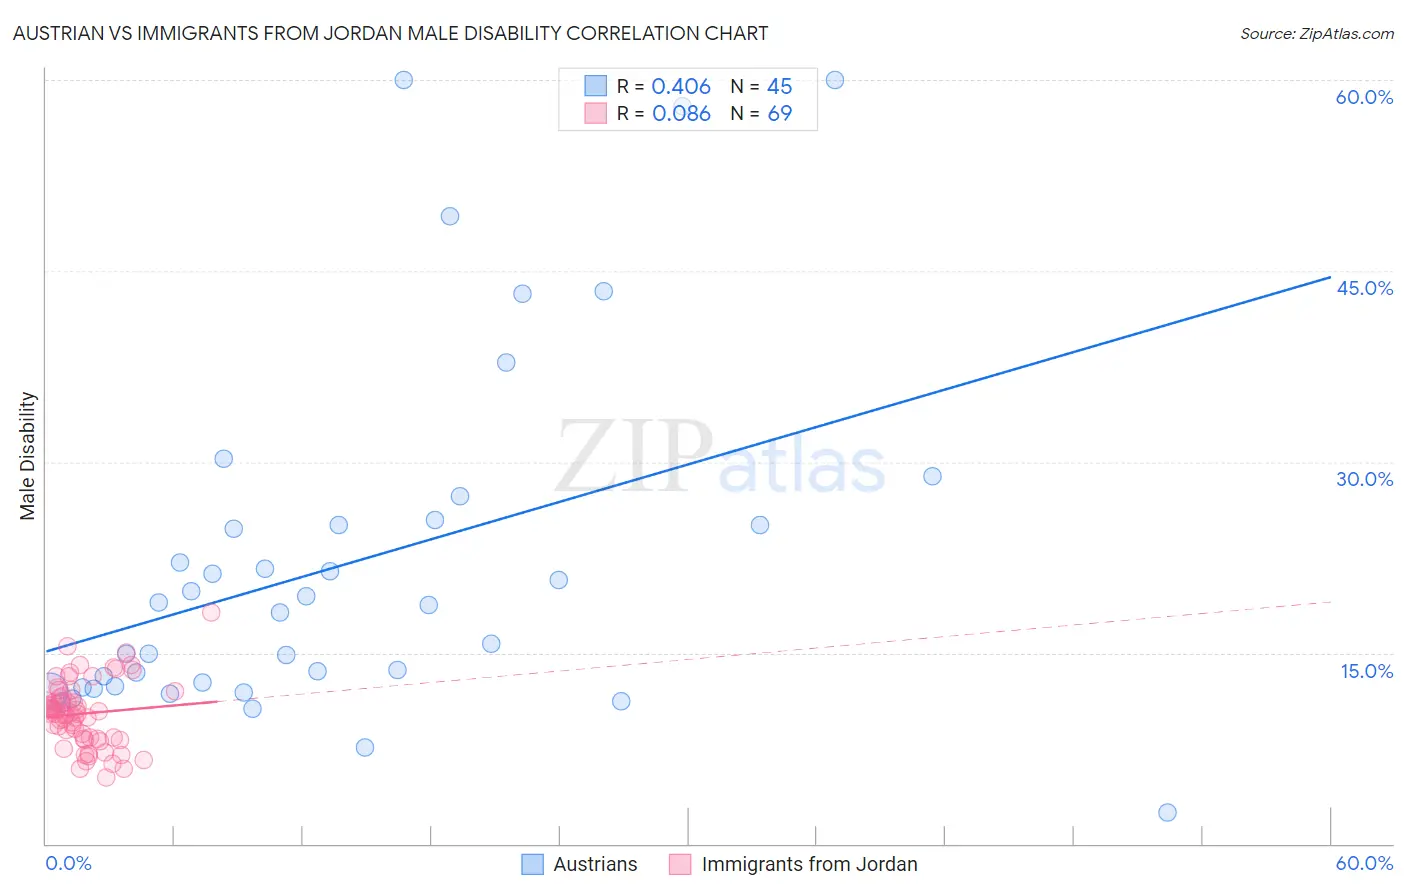
Austrian vs Immigrants from Jordan Male Disability Correlation Chart
The statistical analysis conducted on geographies consisting of 452,033,599 people shows a moderate positive correlation between the proportion of Austrians and percentage of males with a disability in the United States with a correlation coefficient (R) of 0.406 and weighted average of 11.8%. Similarly, the statistical analysis conducted on geographies consisting of 181,276,340 people shows a slight positive correlation between the proportion of Immigrants from Jordan and percentage of males with a disability in the United States with a correlation coefficient (R) of 0.086 and weighted average of 10.6%, a difference of 11.4%.
Male Disability Correlation Summary
| Measurement | Austrian | Immigrants from Jordan |
| Minimum | 2.5% | 5.2% |
| Maximum | 60.0% | 18.2% |
| Range | 57.5% | 13.0% |
| Mean | 22.1% | 10.2% |
| Median | 18.8% | 10.2% |
| Interquartile 25% (IQ1) | 12.3% | 8.3% |
| Interquartile 75% (IQ3) | 25.2% | 11.5% |
| Interquartile Range (IQR) | 12.9% | 3.2% |
| Standard Deviation (Sample) | 13.9% | 2.5% |
| Standard Deviation (Population) | 13.8% | 2.5% |
Similar Demographics by Male Disability
Demographics Similar to Austrians by Male Disability
In terms of male disability, the demographic groups most similar to Austrians are Hispanic or Latino (11.8%, a difference of 0.080%), Bermudan (11.8%, a difference of 0.11%), Subsaharan African (11.8%, a difference of 0.18%), Croatian (11.8%, a difference of 0.20%), and Liberian (11.8%, a difference of 0.30%).
| Demographics | Rating | Rank | Male Disability |
| Immigrants | Western Europe | 3.8 /100 | #220 | Tragic 11.7% |
| Immigrants | Congo | 3.7 /100 | #221 | Tragic 11.7% |
| Alsatians | 3.3 /100 | #222 | Tragic 11.7% |
| Immigrants | Bahamas | 3.2 /100 | #223 | Tragic 11.7% |
| Japanese | 3.1 /100 | #224 | Tragic 11.7% |
| Liberians | 3.1 /100 | #225 | Tragic 11.8% |
| Sub-Saharan Africans | 2.8 /100 | #226 | Tragic 11.8% |
| Austrians | 2.5 /100 | #227 | Tragic 11.8% |
| Hispanics or Latinos | 2.3 /100 | #228 | Tragic 11.8% |
| Bermudans | 2.3 /100 | #229 | Tragic 11.8% |
| Croatians | 2.1 /100 | #230 | Tragic 11.8% |
| Dominicans | 1.8 /100 | #231 | Tragic 11.8% |
| Malaysians | 1.8 /100 | #232 | Tragic 11.8% |
| Mexicans | 1.7 /100 | #233 | Tragic 11.8% |
| Immigrants | Canada | 1.6 /100 | #234 | Tragic 11.9% |
Demographics Similar to Immigrants from Jordan by Male Disability
In terms of male disability, the demographic groups most similar to Immigrants from Jordan are Zimbabwean (10.6%, a difference of 0.020%), Immigrants from Chile (10.6%, a difference of 0.060%), Immigrants from Guyana (10.6%, a difference of 0.13%), Immigrants from Poland (10.6%, a difference of 0.19%), and Bulgarian (10.6%, a difference of 0.20%).
| Demographics | Rating | Rank | Male Disability |
| Immigrants | Lithuania | 98.9 /100 | #73 | Exceptional 10.5% |
| Immigrants | Lebanon | 98.8 /100 | #74 | Exceptional 10.5% |
| Sierra Leoneans | 98.7 /100 | #75 | Exceptional 10.5% |
| Immigrants | Sierra Leone | 98.7 /100 | #76 | Exceptional 10.5% |
| Laotians | 98.6 /100 | #77 | Exceptional 10.6% |
| Immigrants | Russia | 98.6 /100 | #78 | Exceptional 10.6% |
| Zimbabweans | 98.4 /100 | #79 | Exceptional 10.6% |
| Immigrants | Jordan | 98.4 /100 | #80 | Exceptional 10.6% |
| Immigrants | Chile | 98.3 /100 | #81 | Exceptional 10.6% |
| Immigrants | Guyana | 98.2 /100 | #82 | Exceptional 10.6% |
| Immigrants | Poland | 98.1 /100 | #83 | Exceptional 10.6% |
| Bulgarians | 98.1 /100 | #84 | Exceptional 10.6% |
| Sri Lankans | 97.9 /100 | #85 | Exceptional 10.6% |
| Immigrants | Ireland | 97.9 /100 | #86 | Exceptional 10.6% |
| Immigrants | Vietnam | 97.9 /100 | #87 | Exceptional 10.6% |