Austrian vs Immigrants from Uganda Male Disability
COMPARE
Austrian
Immigrants from Uganda
Male Disability
Male Disability Comparison
Austrians
Immigrants from Uganda
11.8%
MALE DISABILITY
2.5/ 100
METRIC RATING
227th/ 347
METRIC RANK
10.8%
MALE DISABILITY
94.0/ 100
METRIC RATING
109th/ 347
METRIC RANK
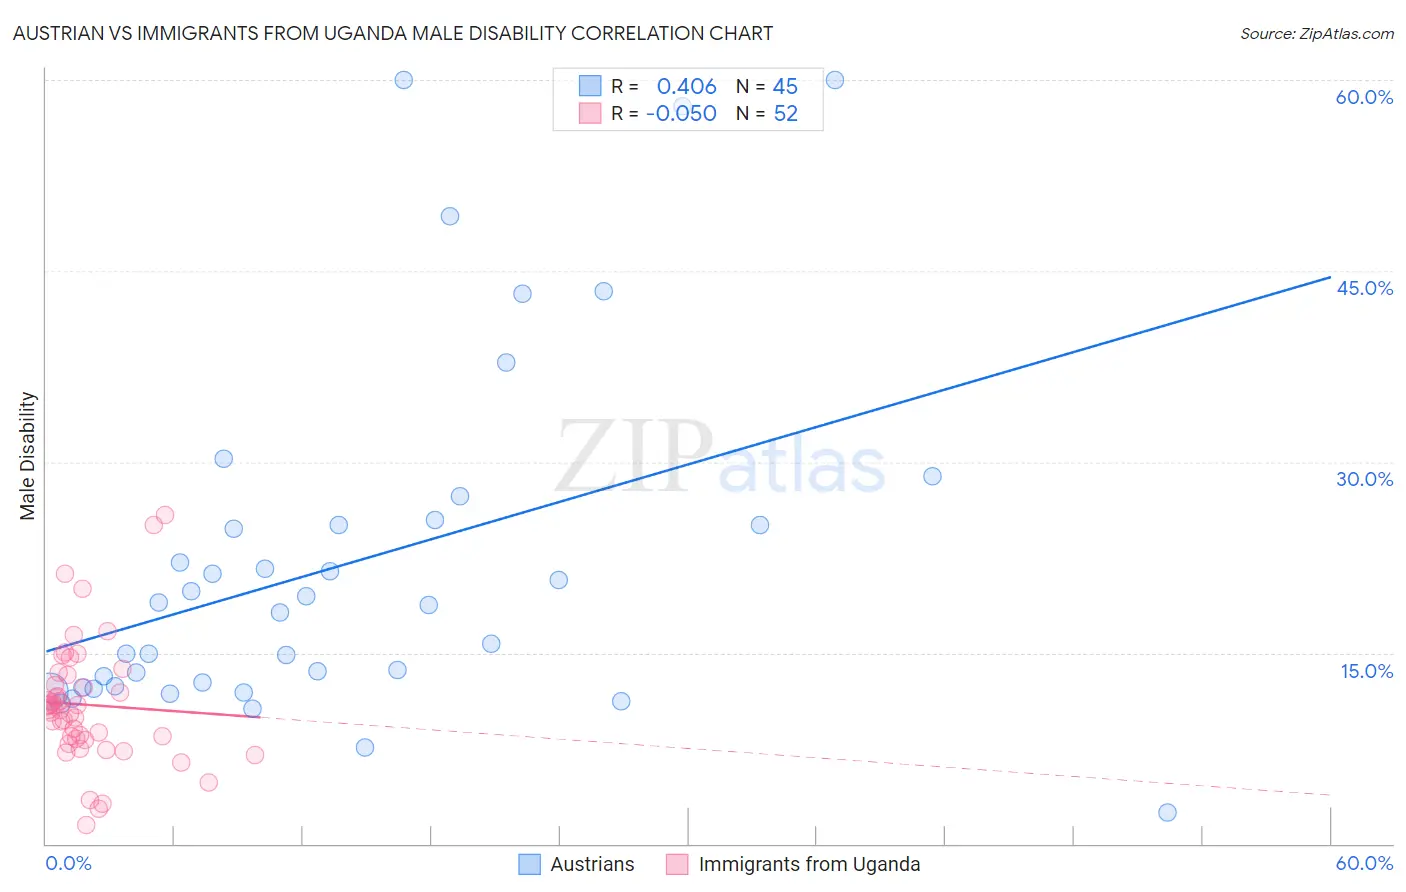
Austrian vs Immigrants from Uganda Male Disability Correlation Chart
The statistical analysis conducted on geographies consisting of 452,033,599 people shows a moderate positive correlation between the proportion of Austrians and percentage of males with a disability in the United States with a correlation coefficient (R) of 0.406 and weighted average of 11.8%. Similarly, the statistical analysis conducted on geographies consisting of 125,978,860 people shows a slight negative correlation between the proportion of Immigrants from Uganda and percentage of males with a disability in the United States with a correlation coefficient (R) of -0.050 and weighted average of 10.8%, a difference of 9.2%.
Male Disability Correlation Summary
| Measurement | Austrian | Immigrants from Uganda |
| Minimum | 2.5% | 1.5% |
| Maximum | 60.0% | 25.8% |
| Range | 57.5% | 24.3% |
| Mean | 22.1% | 10.9% |
| Median | 18.8% | 10.5% |
| Interquartile 25% (IQ1) | 12.3% | 8.2% |
| Interquartile 75% (IQ3) | 25.2% | 12.8% |
| Interquartile Range (IQR) | 12.9% | 4.7% |
| Standard Deviation (Sample) | 13.9% | 4.9% |
| Standard Deviation (Population) | 13.8% | 4.8% |
Similar Demographics by Male Disability
Demographics Similar to Austrians by Male Disability
In terms of male disability, the demographic groups most similar to Austrians are Hispanic or Latino (11.8%, a difference of 0.080%), Bermudan (11.8%, a difference of 0.11%), Subsaharan African (11.8%, a difference of 0.18%), Croatian (11.8%, a difference of 0.20%), and Liberian (11.8%, a difference of 0.30%).
| Demographics | Rating | Rank | Male Disability |
| Immigrants | Western Europe | 3.8 /100 | #220 | Tragic 11.7% |
| Immigrants | Congo | 3.7 /100 | #221 | Tragic 11.7% |
| Alsatians | 3.3 /100 | #222 | Tragic 11.7% |
| Immigrants | Bahamas | 3.2 /100 | #223 | Tragic 11.7% |
| Japanese | 3.1 /100 | #224 | Tragic 11.7% |
| Liberians | 3.1 /100 | #225 | Tragic 11.8% |
| Sub-Saharan Africans | 2.8 /100 | #226 | Tragic 11.8% |
| Austrians | 2.5 /100 | #227 | Tragic 11.8% |
| Hispanics or Latinos | 2.3 /100 | #228 | Tragic 11.8% |
| Bermudans | 2.3 /100 | #229 | Tragic 11.8% |
| Croatians | 2.1 /100 | #230 | Tragic 11.8% |
| Dominicans | 1.8 /100 | #231 | Tragic 11.8% |
| Malaysians | 1.8 /100 | #232 | Tragic 11.8% |
| Mexicans | 1.7 /100 | #233 | Tragic 11.8% |
| Immigrants | Canada | 1.6 /100 | #234 | Tragic 11.9% |
Demographics Similar to Immigrants from Uganda by Male Disability
In terms of male disability, the demographic groups most similar to Immigrants from Uganda are Immigrants (10.8%, a difference of 0.030%), Immigrants from Belgium (10.8%, a difference of 0.050%), Immigrants from Uruguay (10.8%, a difference of 0.060%), Immigrants from Eastern Africa (10.8%, a difference of 0.070%), and Ghanaian (10.8%, a difference of 0.16%).
| Demographics | Rating | Rank | Male Disability |
| Immigrants | Eastern Europe | 95.3 /100 | #102 | Exceptional 10.7% |
| Uruguayans | 95.3 /100 | #103 | Exceptional 10.7% |
| Immigrants | Nigeria | 95.1 /100 | #104 | Exceptional 10.8% |
| Immigrants | Brazil | 95.0 /100 | #105 | Exceptional 10.8% |
| Immigrants | Syria | 94.9 /100 | #106 | Exceptional 10.8% |
| Immigrants | Eastern Africa | 94.3 /100 | #107 | Exceptional 10.8% |
| Immigrants | Belgium | 94.2 /100 | #108 | Exceptional 10.8% |
| Immigrants | Uganda | 94.0 /100 | #109 | Exceptional 10.8% |
| Immigrants | Immigrants | 93.9 /100 | #110 | Exceptional 10.8% |
| Immigrants | Uruguay | 93.8 /100 | #111 | Exceptional 10.8% |
| Ghanaians | 93.4 /100 | #112 | Exceptional 10.8% |
| Immigrants | Zimbabwe | 93.0 /100 | #113 | Exceptional 10.8% |
| Central Americans | 92.7 /100 | #114 | Exceptional 10.8% |
| Immigrants | Barbados | 92.2 /100 | #115 | Exceptional 10.8% |
| Immigrants | South Africa | 91.8 /100 | #116 | Exceptional 10.8% |