Australian vs U.S. Virgin Islander Male Disability
COMPARE
Australian
U.S. Virgin Islander
Male Disability
Male Disability Comparison
Australians
U.S. Virgin Islanders
11.3%
MALE DISABILITY
42.2/ 100
METRIC RATING
178th/ 347
METRIC RANK
11.9%
MALE DISABILITY
1.3/ 100
METRIC RATING
236th/ 347
METRIC RANK
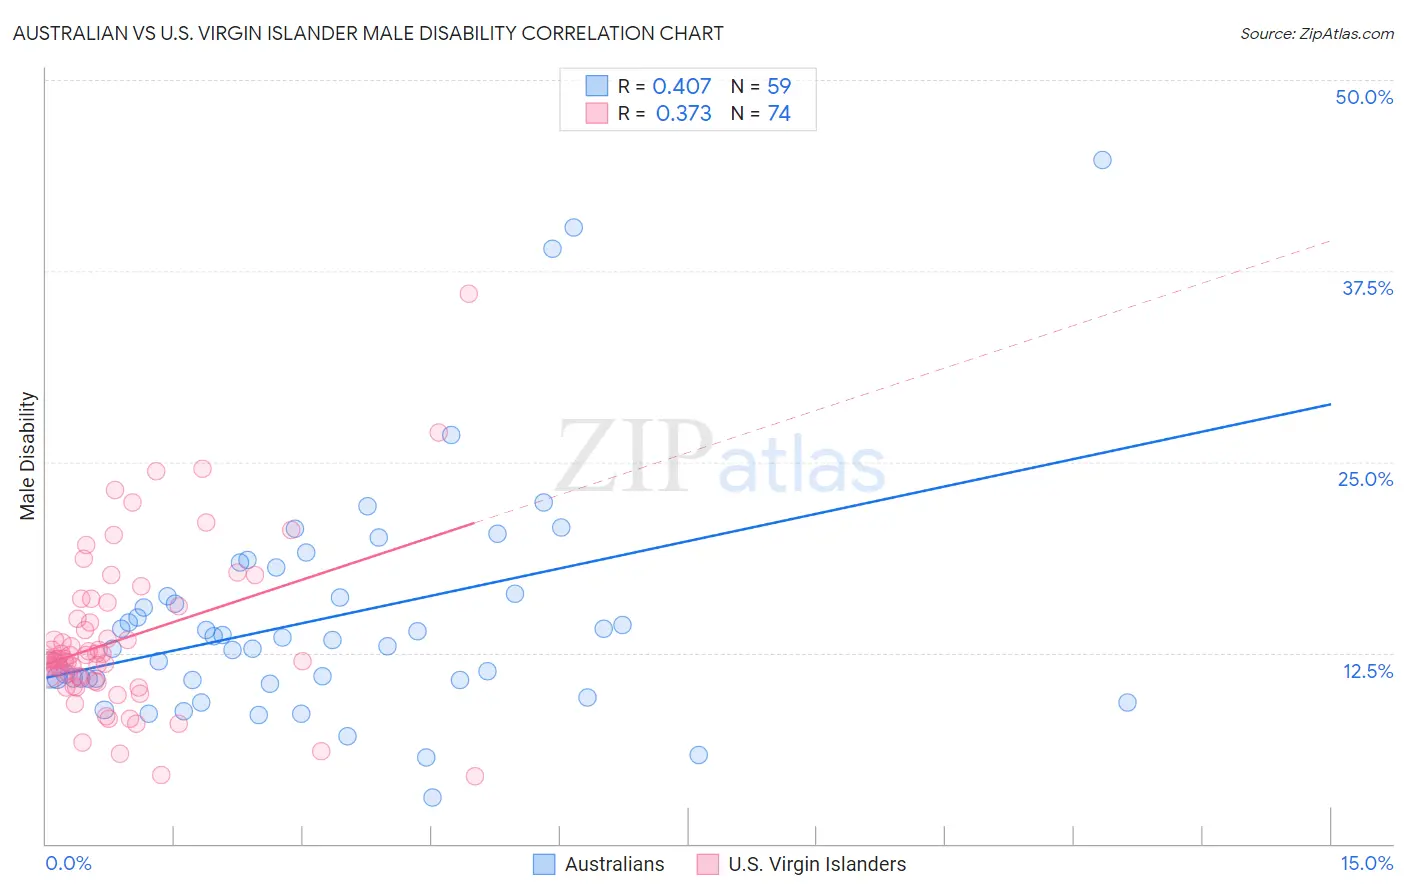
Australian vs U.S. Virgin Islander Male Disability Correlation Chart
The statistical analysis conducted on geographies consisting of 224,140,588 people shows a moderate positive correlation between the proportion of Australians and percentage of males with a disability in the United States with a correlation coefficient (R) of 0.407 and weighted average of 11.3%. Similarly, the statistical analysis conducted on geographies consisting of 87,521,484 people shows a mild positive correlation between the proportion of U.S. Virgin Islanders and percentage of males with a disability in the United States with a correlation coefficient (R) of 0.373 and weighted average of 11.9%, a difference of 5.5%.
Male Disability Correlation Summary
| Measurement | Australian | U.S. Virgin Islander |
| Minimum | 3.0% | 4.4% |
| Maximum | 44.7% | 36.0% |
| Range | 41.7% | 31.6% |
| Mean | 14.8% | 13.4% |
| Median | 13.3% | 12.1% |
| Interquartile 25% (IQ1) | 10.8% | 10.6% |
| Interquartile 75% (IQ3) | 16.4% | 15.5% |
| Interquartile Range (IQR) | 5.6% | 4.9% |
| Standard Deviation (Sample) | 7.7% | 5.3% |
| Standard Deviation (Population) | 7.6% | 5.3% |
Similar Demographics by Male Disability
Demographics Similar to Australians by Male Disability
In terms of male disability, the demographic groups most similar to Australians are Immigrants from Caribbean (11.3%, a difference of 0.040%), Honduran (11.3%, a difference of 0.060%), Immigrants from Norway (11.3%, a difference of 0.11%), Syrian (11.2%, a difference of 0.24%), and Immigrants from Honduras (11.2%, a difference of 0.36%).
| Demographics | Rating | Rank | Male Disability |
| Haitians | 52.5 /100 | #171 | Average 11.2% |
| Romanians | 50.7 /100 | #172 | Average 11.2% |
| Immigrants | Burma/Myanmar | 50.4 /100 | #173 | Average 11.2% |
| Maltese | 50.0 /100 | #174 | Average 11.2% |
| Immigrants | Honduras | 48.7 /100 | #175 | Average 11.2% |
| Syrians | 46.6 /100 | #176 | Average 11.2% |
| Immigrants | Norway | 44.2 /100 | #177 | Average 11.3% |
| Australians | 42.2 /100 | #178 | Average 11.3% |
| Immigrants | Caribbean | 41.4 /100 | #179 | Average 11.3% |
| Hondurans | 41.1 /100 | #180 | Average 11.3% |
| Immigrants | Senegal | 34.4 /100 | #181 | Fair 11.3% |
| Immigrants | Belize | 33.7 /100 | #182 | Fair 11.3% |
| Immigrants | Central America | 32.9 /100 | #183 | Fair 11.3% |
| Iraqis | 30.5 /100 | #184 | Fair 11.3% |
| Pakistanis | 30.3 /100 | #185 | Fair 11.3% |
Demographics Similar to U.S. Virgin Islanders by Male Disability
In terms of male disability, the demographic groups most similar to U.S. Virgin Islanders are Carpatho Rusyn (11.9%, a difference of 0.010%), Yugoslavian (11.9%, a difference of 0.11%), Immigrants from North America (11.9%, a difference of 0.14%), Italian (11.9%, a difference of 0.16%), and Czech (11.9%, a difference of 0.21%).
| Demographics | Rating | Rank | Male Disability |
| Bermudans | 2.3 /100 | #229 | Tragic 11.8% |
| Croatians | 2.1 /100 | #230 | Tragic 11.8% |
| Dominicans | 1.8 /100 | #231 | Tragic 11.8% |
| Malaysians | 1.8 /100 | #232 | Tragic 11.8% |
| Mexicans | 1.7 /100 | #233 | Tragic 11.8% |
| Immigrants | Canada | 1.6 /100 | #234 | Tragic 11.9% |
| Immigrants | North America | 1.5 /100 | #235 | Tragic 11.9% |
| U.S. Virgin Islanders | 1.3 /100 | #236 | Tragic 11.9% |
| Carpatho Rusyns | 1.3 /100 | #237 | Tragic 11.9% |
| Yugoslavians | 1.2 /100 | #238 | Tragic 11.9% |
| Italians | 1.2 /100 | #239 | Tragic 11.9% |
| Czechs | 1.1 /100 | #240 | Tragic 11.9% |
| Bahamians | 1.1 /100 | #241 | Tragic 11.9% |
| Northern Europeans | 1.1 /100 | #242 | Tragic 11.9% |
| Samoans | 1.1 /100 | #243 | Tragic 11.9% |