Australian vs Palestinian Male Disability
COMPARE
Australian
Palestinian
Male Disability
Male Disability Comparison
Australians
Palestinians
11.3%
MALE DISABILITY
42.2/ 100
METRIC RATING
178th/ 347
METRIC RANK
10.7%
MALE DISABILITY
97.4/ 100
METRIC RATING
92nd/ 347
METRIC RANK
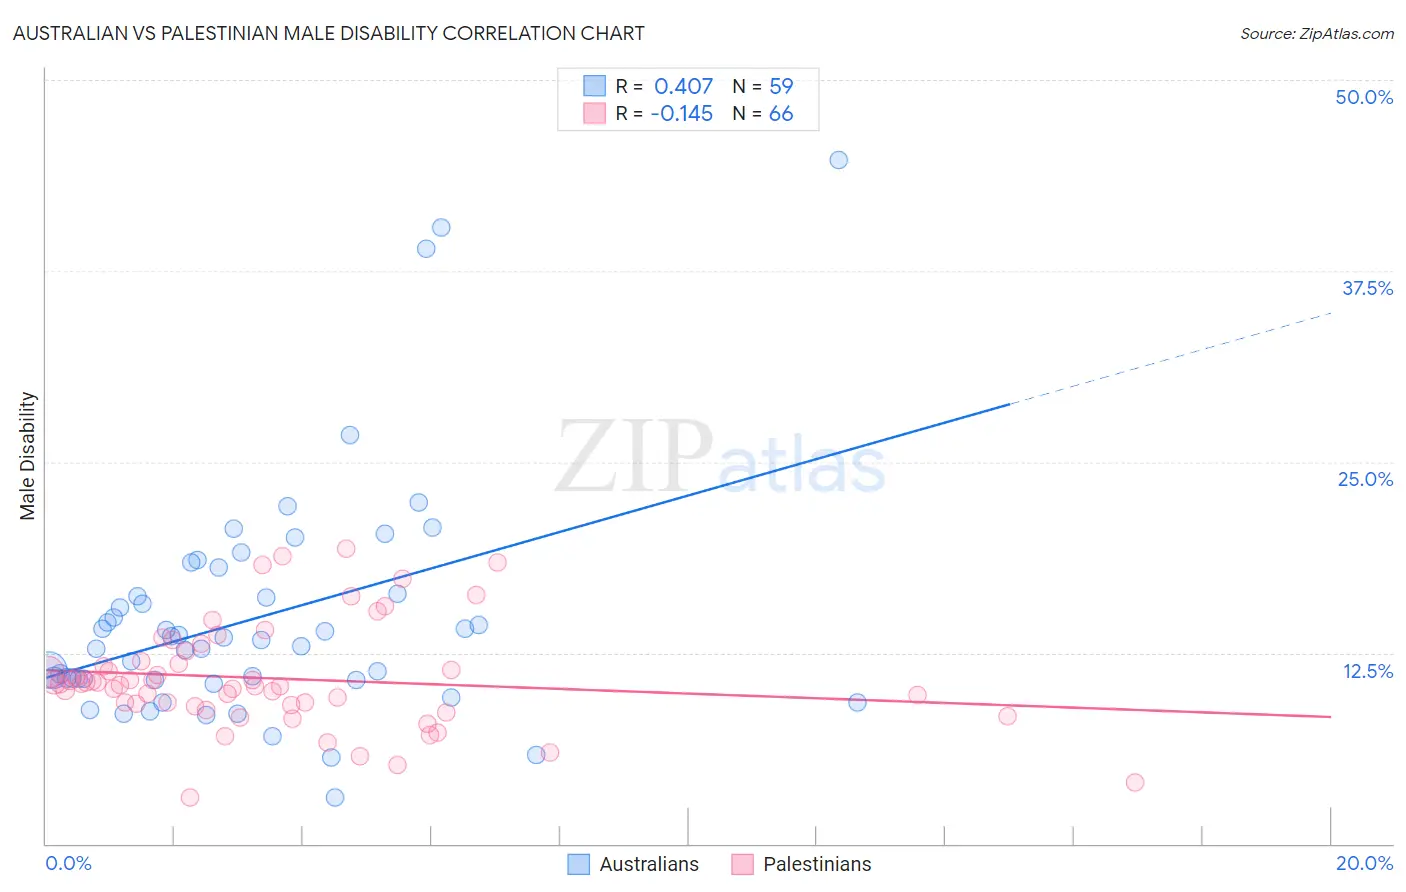
Australian vs Palestinian Male Disability Correlation Chart
The statistical analysis conducted on geographies consisting of 224,140,588 people shows a moderate positive correlation between the proportion of Australians and percentage of males with a disability in the United States with a correlation coefficient (R) of 0.407 and weighted average of 11.3%. Similarly, the statistical analysis conducted on geographies consisting of 216,464,245 people shows a poor negative correlation between the proportion of Palestinians and percentage of males with a disability in the United States with a correlation coefficient (R) of -0.145 and weighted average of 10.7%, a difference of 5.7%.
Male Disability Correlation Summary
| Measurement | Australian | Palestinian |
| Minimum | 3.0% | 3.0% |
| Maximum | 44.7% | 19.3% |
| Range | 41.7% | 16.3% |
| Mean | 14.8% | 10.8% |
| Median | 13.3% | 10.5% |
| Interquartile 25% (IQ1) | 10.8% | 9.1% |
| Interquartile 75% (IQ3) | 16.4% | 12.0% |
| Interquartile Range (IQR) | 5.6% | 2.9% |
| Standard Deviation (Sample) | 7.7% | 3.4% |
| Standard Deviation (Population) | 7.6% | 3.4% |
Similar Demographics by Male Disability
Demographics Similar to Australians by Male Disability
In terms of male disability, the demographic groups most similar to Australians are Immigrants from Caribbean (11.3%, a difference of 0.040%), Honduran (11.3%, a difference of 0.060%), Immigrants from Norway (11.3%, a difference of 0.11%), Syrian (11.2%, a difference of 0.24%), and Immigrants from Honduras (11.2%, a difference of 0.36%).
| Demographics | Rating | Rank | Male Disability |
| Haitians | 52.5 /100 | #171 | Average 11.2% |
| Romanians | 50.7 /100 | #172 | Average 11.2% |
| Immigrants | Burma/Myanmar | 50.4 /100 | #173 | Average 11.2% |
| Maltese | 50.0 /100 | #174 | Average 11.2% |
| Immigrants | Honduras | 48.7 /100 | #175 | Average 11.2% |
| Syrians | 46.6 /100 | #176 | Average 11.2% |
| Immigrants | Norway | 44.2 /100 | #177 | Average 11.3% |
| Australians | 42.2 /100 | #178 | Average 11.3% |
| Immigrants | Caribbean | 41.4 /100 | #179 | Average 11.3% |
| Hondurans | 41.1 /100 | #180 | Average 11.3% |
| Immigrants | Senegal | 34.4 /100 | #181 | Fair 11.3% |
| Immigrants | Belize | 33.7 /100 | #182 | Fair 11.3% |
| Immigrants | Central America | 32.9 /100 | #183 | Fair 11.3% |
| Iraqis | 30.5 /100 | #184 | Fair 11.3% |
| Pakistanis | 30.3 /100 | #185 | Fair 11.3% |
Demographics Similar to Palestinians by Male Disability
In terms of male disability, the demographic groups most similar to Palestinians are Immigrants from St. Vincent and the Grenadines (10.7%, a difference of 0.13%), Immigrants from France (10.6%, a difference of 0.15%), Immigrants from Morocco (10.6%, a difference of 0.18%), Immigrants from Western Asia (10.6%, a difference of 0.24%), and Immigrants from Nicaragua (10.6%, a difference of 0.24%).
| Demographics | Rating | Rank | Male Disability |
| Sri Lankans | 97.9 /100 | #85 | Exceptional 10.6% |
| Immigrants | Ireland | 97.9 /100 | #86 | Exceptional 10.6% |
| Immigrants | Vietnam | 97.9 /100 | #87 | Exceptional 10.6% |
| Immigrants | Western Asia | 97.8 /100 | #88 | Exceptional 10.6% |
| Immigrants | Nicaragua | 97.8 /100 | #89 | Exceptional 10.6% |
| Immigrants | Morocco | 97.7 /100 | #90 | Exceptional 10.6% |
| Immigrants | France | 97.6 /100 | #91 | Exceptional 10.6% |
| Palestinians | 97.4 /100 | #92 | Exceptional 10.7% |
| Immigrants | St. Vincent and the Grenadines | 97.1 /100 | #93 | Exceptional 10.7% |
| Immigrants | Sweden | 96.9 /100 | #94 | Exceptional 10.7% |
| Chileans | 96.9 /100 | #95 | Exceptional 10.7% |
| Nicaraguans | 96.6 /100 | #96 | Exceptional 10.7% |
| Immigrants | Armenia | 96.6 /100 | #97 | Exceptional 10.7% |
| Immigrants | Romania | 96.5 /100 | #98 | Exceptional 10.7% |
| Immigrants | Switzerland | 96.1 /100 | #99 | Exceptional 10.7% |